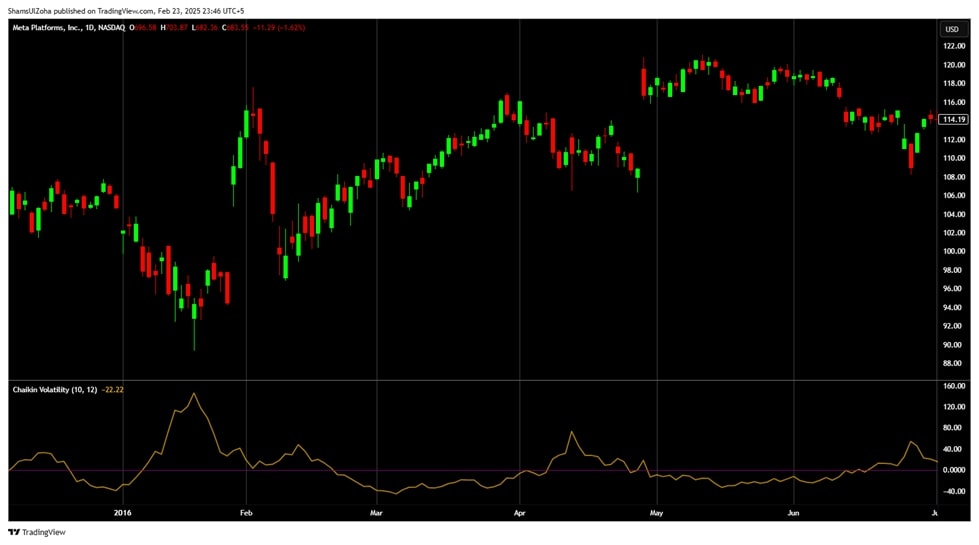
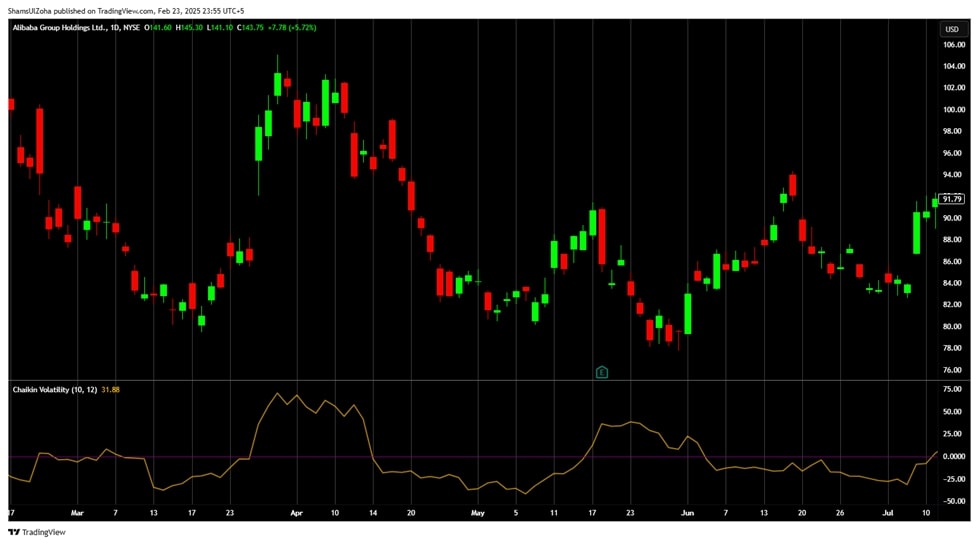
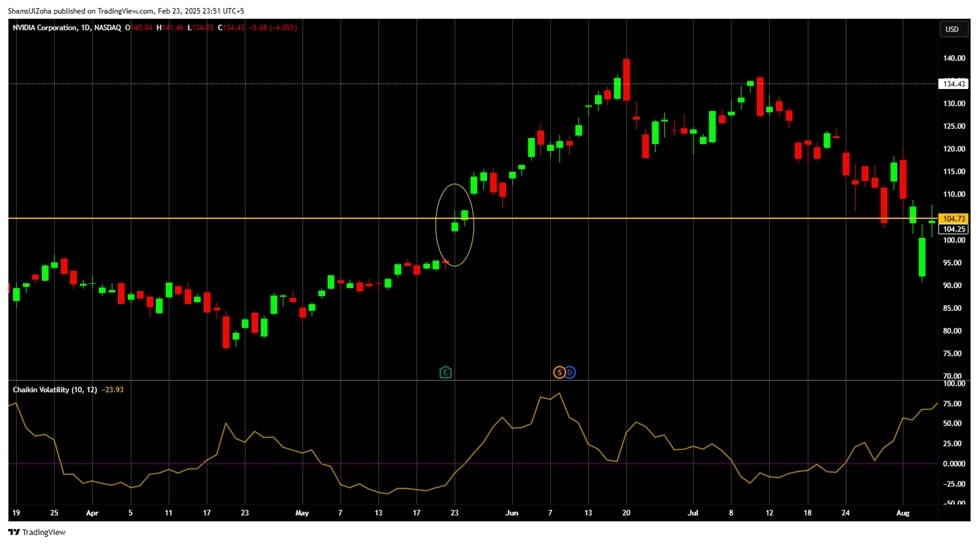
The Chaikin Volatility trading Indicator developed by Marc Chaikin, is a powerful tool that measures market volatility by tracking the difference between high and low prices over a given period. Unlike the Average True Range (ATR), the Chaikin Volatility Indicator ignores price gaps and focuses solely on the spread between high and low prices.
This article explains how the Chaikin Volatility Indicator works, how to interpret it, and how to incorporate it into a trading system for stocks.

What is the Chaikin Volatility Indicator?
The Chaikin Volatility Indicator analyses the rate of change in the high-low price range over a specified period. It helps traders determine whether volatility is increasing or decreasing, which can be useful in spotting market tops, bottoms, and potential reversals.
The volatility is calculated by determining the Exponential Moving Average (EMA) of the difference between the high and low prices over a certain number of periods. This value is then compared to the EMA from a past period to calculate the percentage change. The result is a dynamic measure of volatility that helps traders anticipate market shifts.
How to Interpret the Chaikin Volatility Indicator
When the Chaikin Volatility Indicator rises, it signals increasing volatility, often occurring before breakouts or trend continuations. A sharp increase in volatility can indicate growing uncertainty or increased market activity.
On the other hand, a declining indicator suggests a period of low volatility. This may indicate a market that is consolidating before a significant price move. Traders should be particularly attentive when volatility is low for an extended period, as it often precedes a breakout.

Market tops often show an initial spike in volatility followed by a decline, if a stock reaches a new high and volatility drops, it could suggest a weakening uptrend. In contrast, market bottoms frequently exhibit decreasing volatility over time, followed by a sudden surge as selling pressure intensifies, this can indicate a potential reversal.
Using the Chaikin Volatility Indicator in Stock Trading
One of the most effective ways to use the Chaikin Volatility Indicator is to confirm trend strength. If both price and volatility are rising, the trend is likely to be strong, however if the price is increasing while volatility is declining, the trend may be losing momentum.
The indicator is also useful in identifying breakout opportunities. When the Chaikin Volatility Indicator has been low for a prolonged period and suddenly starts to rise, it may signal an impending price move. This is particularly valuable when combined with price action, such as a stock breaking out of a trading range.
Traders can also use the indicator to spot potential reversals, if volatility spikes just before a market peak, it suggests nervous trading activity, often leading to a reversal. Likewise, if volatility spikes during a strong downtrend, it may indicate panic selling, which can be followed by a rebound.
A Trading Strategy Using the Chaikin Volatility Indicator
A simple trading approach involves using a 10-period EMA for the high-low range and a 10-period lookback for comparison. When the Chaikin Volatility Indicator starts to rise after a prolonged period of low volatility, it suggests that a price move is imminent.
A potential buy signal occurs when volatility begins to increase and the stock price breaks above a key resistance level. Confirmation from an indicator such as the Relative Strength Index (RSI) moving above 50 can strengthen the signal.

This high value indicates that traders should watch for a peak in volatility followed by a decrease. If the stock price begins to decline and volatility starts dropping, it may indicate the end of the trend. Confirmation from the RSI dropping below 50 can further validate the trade.
Best Practices for Trading with the Chaikin Volatility Indicator
Backtesting the indicator with historical data is essential before using it in live trading. This allows traders to determine whether the default settings work for a particular stock or if adjustments are needed. Additionally, it is important to recognize that while high volatility presents opportunities, it also increases risk, proper position sizing is crucial to managing potential losses.
How to Use the Chaikin Volatility Indicator with Other Technical Indicators
While the Chaikin Volatility Indicator is a valuable tool, it works best when combined with other technical indicators. Moving averages help confirm trend direction, while Bollinger Bands provide additional insights into price volatility. Using the indicator alongside price envelopes can also improve trade accuracy.
Chaikin Volatility Strategy with Moving Averages and RSI
This combination is ideal for trend-following traders, when the Chaikin Volatility Indicator starts rising, it suggests increasing market activity. If the stock price is above the 50-day moving average and the RSI is above 50, it confirms bullish momentum. A buy signal occurs when all three conditions align, while an exit signal appears when volatility declines, the price drops below the moving average, or RSI falls under 50.
Chaikin Volatility Strategy with Bollinger Bands and MACD
For breakout strategies, combining the Chaikin Volatility Indicator with Bollinger Bands and MACD helps identify potential price surges. If the indicator rises after a low-volatility period and Bollinger Bands expand, it suggests an impending breakout. A MACD crossover above the signal line confirms bullish momentum. Traders can exit when volatility drops, the band’s contract, and MACD turns bearish.
Chaikin Volatility Strategy with Price Envelopes and the Stochastic Oscillator
Mean reversion traders can use the Chaikin Volatility Indicator with price envelopes and the Stochastic Oscillator to spot reversals. If volatility is high and the stock reaches the upper price envelope while the Stochastic Oscillator is above 80, it signals an overbought condition. A short trade may be appropriate. Conversely, a buying opportunity arises when volatility is high, the price reaches the lower envelope, and the Stochastic Oscillator is below 20.
Conclusion and Next Steps
The Chaikin Volatility Indicator provides traders with a clear way to measure market volatility and anticipate significant price movements.
When used correctly, this indicator enhances decision-making and helps traders manage risk more effectively. However, it should always be used in conjunction with other analysis methods for the best results.
For traders looking to build a structured and profitable stock trading system, incorporating volatility analysis into a well-defined strategy can lead to more consistent success. If you are serious about eliminating guesswork and trading with confidence, apply now to the Trader Success System.


