Drawdown in trading is an important risk measure to understand and master when you learn stock trading. It is given a lot of lip service in trading system development literature but there is very little practical information on how to manage and reduce drawdown in your stock trading systems.
Most stock traders generally understand that you don’t want to have large drawdowns and you want to limit your risk, but realistically, most traders focus on return when they are developing trading systems. In this post, I am focusing on the drawdown side to bring up some of the issues and share some interesting issues and ideas for you to consider in your trading system development.
What is the definition of drawdown in stock trading?
I first want to give a clear definition of drawdown in trading. The definition is the same whether we are talking about a trading strategy or a trading system. When you run a backtest, you get an equity curve that shows you how your portfolio would have grown over time if you had followed those trading rules in the past. At any point on the backtest, it might make a new high relative to the previous equity values in the backtest. As you move forward from that new high, it could keep going up, in which case there’s no drawdown or the equity could fall, in which case that’s a drawdown.
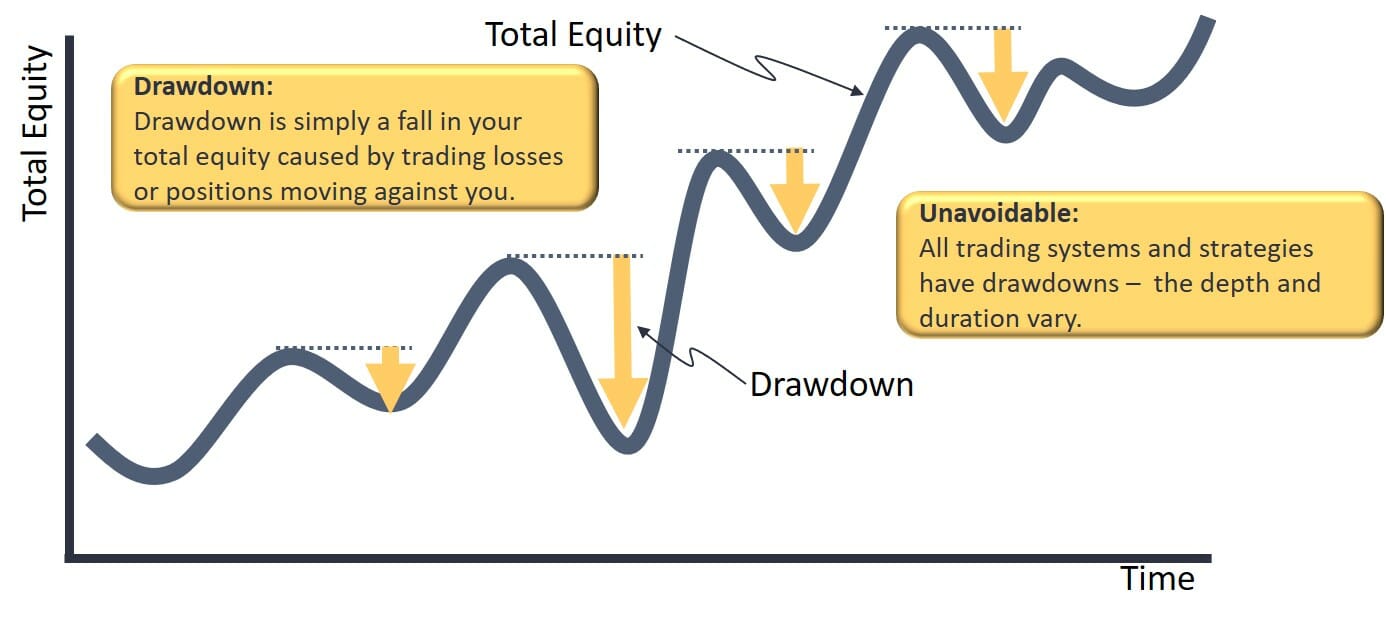
At any point on your equity curve, you’re looking forward to see what the largest percentage decline is from an equity high to a subsequent equity low. This percentage decline is the drawdown that your trading system experienced from that point. In Amibroker when you run your backtest you get two main graphical outputs.
The first is the equity curve which looks like this:

The second is the underwater equity curve chart. This shows the size of drawdowns at each point on your equity curve, how frequently they occur and how regular they are. This is a graphical illustration of drawdown as a risk measure. Ideally, you want to see low and consistent drawdown levels over time. Increasing drawdowns over time (from left to right on the chart below) would indicate that the drawdown risk is increasing over time and the trading strategy is getting more unstable/risky.
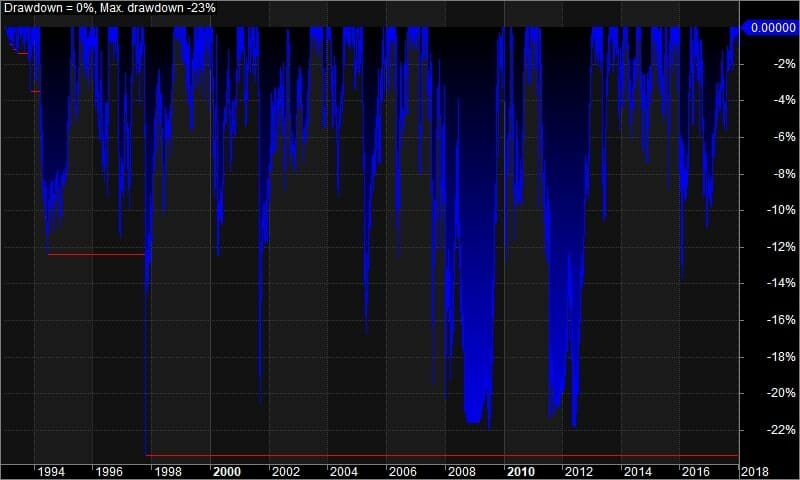
The underwater equity curve you get when you backtest your trading system in Amibroker shows you the percentage drop from the highest point on your equity curve to the subsequent low. This shows you what the percentage drop in your equity would have had if you were trading the system at that time.
You should be aiming to minimize your drawdown in trading as much as possible for a given level of return… or maximising your returns for a given deepest drawdown level. There is always a tradeoff between drawdown and return that we have to work with as systematic traders.
What Drawdowns Tell You
The deepest drawdown in the backtest tells us what the historical risk was for the trading systems we are analysing. The deepest drawdown in our backtest gives us an indication of how much our equity could drop when we experience a losing streak or series of losses. They are a measure of downside risk and can give us an idea of the level of volatility that we should be prepared for in our trading system.
We can also use the deepest drawdown and the profile of drawdowns to compare different strategies (or asset classes) to decide which one offers the best balance of return and risk for our investment objectives.
Drawdown is also extremely useful when assembling a portfolio of trading strategies. If the drawdown timing between two strategies is highly correlated then combining them will not reduce the risk in the portfolio. However, if the drawdown timing is different and one trading system makes new equity highs while the other one is in drawdown then combining these two strategies into a portfolio reduces the overall risk and smooths our returns.
It is important to have an acceptable maximum drawdown level at both the strategy level and the portfolio level, otherwise, we will be exposed to too much risk and could end up with large losses that could take a long time to recover.
Drawdown vs Standard Deviation – Which is a better measure of risk
Two commonly used metrics to measure risk in trading systems are drawdown and standard deviation. Both are useful measures of risk, but the main difference between them is that drawdown is a historical measure while standard deviation is an expected measure.
Drawdown tells us how much our equity has already dropped from its highest level when we experienced losses. Standard deviation, on the other hand, tells us what the expected volatility of our system should be in the future based on past data.
Both are useful measures of risk, but which one is better?
It depends on your trading objectives and what question you are trying to answer. For example, if you have long-term goals such as retirement or capital preservation then drawdown might be more important for you than standard deviation.
Another example is when deciding whether to allocate capital to two different trading strategies, the timing of the drawdowns will tell you about how correlated the systems are in adverse market conditions. If the maximum historical drawdown of both strategies occurs at the same time, then there is little correlation benefit from allocating capital to both.
But if you were trying to decide how much capital to allocate to each of the two strategies then the standard deviation is more useful than the drawdown because it will allow you to adjust the allocations to each system so that the dollar fluctuation of the equity from each is the same.
The important difference between trade drawdown and portfolio drawdown
So there’s one thing that is often misunderstood when new traders think about drawdown risk, and that is the difference between trade drawdown and portfolio drawdown. Many traders will freak out or get concerned when they have a trade and it dips 30% or 40% before exiting or before going on to new highs. They have already planned on a drawdown tolerance of say 20%, but here they are with a trade drawdown of 40%. The conversation usually goes something like
“I was only planning to have a 20% drawdown, but I’ve got this trade with a 40% drawdown so something must be broken; something has gone wrong, I better liquidate this trade”
There is actually nothing wrong because, on a trade basis, the drawdown can be very different than on a portfolio basis where you’ve got many trades compared to an individual trade level. When you backtest your stock trading system, the portfolio level drawdown is the one that you need to be consistent with your psychology and your risk tolerance.
The trade level drawdown is quite different to the portfolio drawdown and is worth understanding and investigating because you can get nervous on an individual trade. Your ability to follow your system can be sabotaged by an individual trade. Even if that individual trade is within the bounds of what’s normal for the system and even if you’re not in a bad drawdown at a system level, one trade can still cause you concern.
When you are looking at individual trade drawdown you use the maximum adverse excursion from the entry of your trade to understand how far each trade can move against you according to your backtest. The Maximum Adverse Excursion (MAE) on a trade can be much higher than your portfolio level drawdown tolerance because many trades combine together to form your portfolio, so they tend to smooth each other out in the portfolio.
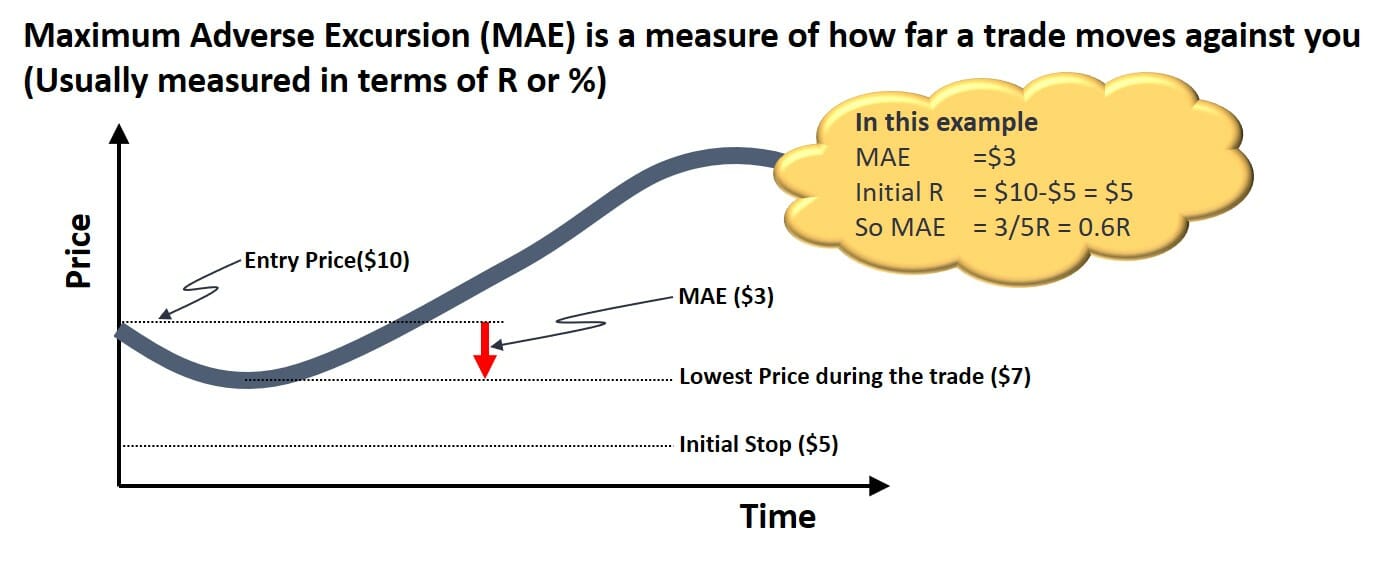
So please do not get concerned about individual trade MAE if the system is achieving your objectives in terms of return and drawdown at a portfolio level. You can use Maximum Adverse Excursion data to find ways of improving the accuracy of the entry signals in your trading system, but it certainly should not be used in any discretionary way to close a trade that has not generated a sell signal on its own.
Why you need to manage your drawdowns and keep them small when trading stocks
So why do you need to keep your drawdowns small? There are many reasons including
- The trading psychology importance of managing drawdowns
- Ability to recover to new equity highs
- Impact on compounding & Interaction with your other systems
- Blowing up your account and starting again
Each of these is covered in the sections below…
The trading psychology importance of managing drawdowns
So why do you need to keep drawdown risk small when you are trading the stock market, or any other instrument for that matter?
The first and most important consideration is your trading psychology. It’s your money, and you want to do something cool with it. You want to buy a new house/car / freedom etc with it. Whenever your account drops, that trading goal is threatened, whether you like it or not. The trouble is, your trading goal is threatened in direct proportion to the size of your drawdown!
The trouble we then have is that our animal instincts kick in – whenever we feel threatened we move into “Fight or Flight” mode. It is a survival instinct that is hard to avoid (something to do with a few million years of evolution – The Fight or Flight response is explained here) When we feel threatened as a species, humans’ stress levels go up and our blood is redirected to our muscles to get us ready to either fight for survival or run (Thus the name ‘Fight or Flight’) the problem with this is as soon as this happens our intelligence falls because our body is ready for action… it is no longer ready to make rational and sometimes complex financial decisions.
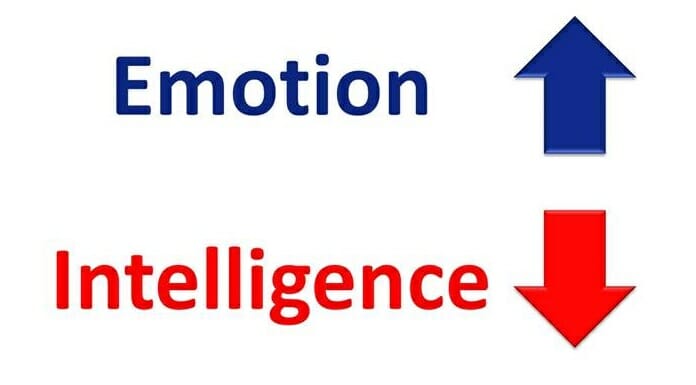
The bigger the size of the drawdown, the more we feel threatened and the more stressed we feel, so the lower the intelligence and the worse financial decisions we are likely to make.
The financial markets are the biggest competition in the world, and if we are going to survive we need to be at the top of our game. Being overwhelmed with stress because of a large drawdown will ensure we are not at the top of our game… and we are more likely to be carried off the field on a stretcher after blowing up our account.
The key to managing your trading psychology when it comes to drawdown is to understand our drawdown tolerance. In The Trader Success System, I give my students a simulation which they use to determine the level of drawdown they start feeling uncomfortable. If you have been trading for a while then you probably have a good idea of the percentage drawdown that caused you to get uncomfortable previously. If you are new to trading then you need to visualise your account falling from current levels and imagine how you would feel at different levels of drawdown. As soon as you start to get uncomfortable, that is your tolerance level.
Once you know your drawdown tolerance level you need to ensure that your portfolio drawdown remains below that level, so you can continue to trade without being emotionally compromised.
So we need to be very mindful of the size of the drawdown we’re currently in and our tolerance levels and make sure that we are not letting ourselves panic when we’re approaching our tolerance level. We have to observe that we’re getting nervous and journal about these thoughts because whenever those psychological stresses occur, the pressure we feel builds up and we risk making poor trading decisions as a result of the stress we are under.
When we are at or over our drawdown tolerance, all it takes is one more loss all of a sudden you could find yourself freaking out and then all of a sudden it explodes into non-systematic trading behaviour and you lose even more money!
Ability to recover to new equity highs
The second major reason you need to control your drawdowns in the stock market and ensure they are small is your ability to recover to new equity highs. The asymmetry of drawdown recovery is one of the most challenging aspects of trading.
If you have a 10% drawdown, you have to make 11% on your equity to get back. If you have a 50% drawdown, you have to make 100% on the remaining equity to get back to break even! For even larger declines it gets even more out of hand as the image below shows.
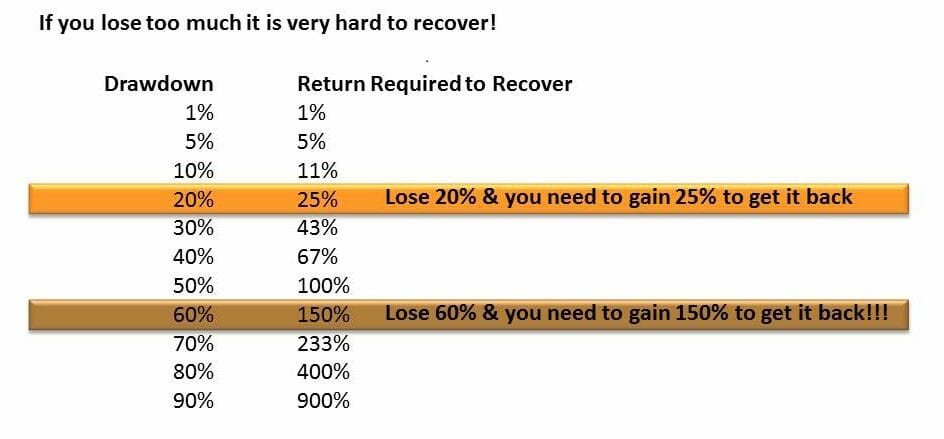
I don’t imagine recovery from a 90% drawdown is a very likely proposition!
The next question you should ask yourself about drawdown recovery is “How long will that take?”
Do have the mental fortitude to keep trading after a huge drawdown?
If you were up at a million dollars and you’re now down at $500,000, and you’re looking up at that hill, trying to make it back to a million, you’re probably feeling completely overwhelmed and you are not in a good space to trade well. Whether it’s $1,000 or $5,000 or $1,000,000 the psychology is the same. It’s all relative to where you’ve been, your experience, the elation of the equity high you felt previously and the level of overwhelm you feel now at your ability to claw your way back.
Your ability to recover psychologically from a drawdown and keep trading is critical!
Impact on compounding & Interaction with your other trading systems
The third point is the impact of the maximum drawdown (MDD) on your long-term compounding. When you run a backtest with one system, you might say, “Oh, it’s got a 50% drawdown, but man, this gives me the best long-term return.” That’s great in isolation.
The difficulty comes when you have multiple systems, they feed off each other because they’re drawing from the same equity pool. So if you have one system that has a 50% drawdown, it stunts the position size and growth in your other systems, and as a result, it stunts the compounding in your other systems too. So even though they may be offsetting each other, a system with a huge max drawdown potential could really be doing a disservice to your portfolio as a whole.
So when you’re combining multiple systems, often it can be better to actually reduce the risk and focus on reducing the drawdown so that they can feed off each other and all compound on top of each other’s gains more quickly, rather than having one big draw downing system.
I much prefer managing the drawdown by designing each of my trading systems to keep the drawdown small so that the whole portfolio of systems works well together and I can achieve smoother portfolio growth.
If you have a portfolio of non-correlated trading systems that is fantastic, but if you have a portfolio of non-correlated trading systems with low drawdown, that’s even better!
Blowing up your account and starting again
The final reason you should aim to keep your maximum drawdown small is to minimise the risk of blowing up your account. While your backtest gives you a lot of information about the expected system drawdown, it is not perfect because the max drawdown in real-time trading could exceed your backtested trading drawdown (This is explained further in the next section). If you have a large drawdown of over 60-70% then your ability to recover is close to zero because you need a HUGE return to get back to new equity highs.
Unfortunately, when traders find themselves in a large drawdown like this there is a huge temptation to trade aggressively to make back the losses. This trading behaviour will almost always end in disaster and blowing up your account. If this happens, the very unfortunate thing is you will end up either quitting trading or having to spend time to save the money to start again. Look what happens to your future net worth if you blow up and lose your account and have to start again:
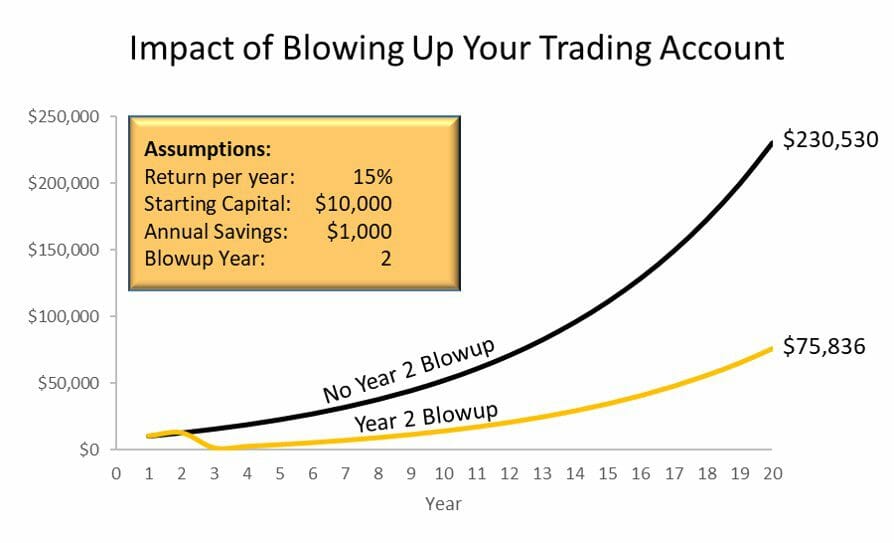
Maintaining a low drawdown and preventing your account from blowing up is not just about the small amount of money in your account now. The impact on your future wealth is devastatingly large, so avoiding huge drawdowns and blowing up your account is critical if you want to become a wealthy and successful stock trader!
How to determine system maximum drawdown (MDD) based on a backtest
When you run a backtest, you’re backtesting on historical data and like it or not there’s going to be some curve fitting in the system design. So when you run the backtest and you determined that the maximum historical drawdown in your backtest is 30% and you’re comfortable with the 30% drawdown, that’s all great provided the future is no worse than the past. But the trouble is what do we know about the magnitude of shocks in the market, about the potential for bigger and bigger uncertainties or panics?
The biggest market shock is always ahead of us!
Like there’s always a potentially bigger panic in the future. It may not come in the short term, but if you trade long enough then you are always going to exceed the maximum historical drawdown that your system achieves in backtesting.
When you run a backtest on your system and you determined that the maximum historical drawdown was 30%, you want to be comfortable with a drawdown bigger than 30% in order to trade that system, because chances are something worse could happen in the future.
As a rule of thumb, your worst case could be the max historical drawdown x 1.5
A useful rule of thumb is to backtest your trading system and look at the maximum historical drawdown times 1.5 and ask yourself whether you could tolerate and survive that. If you can’t survive that with your current capital allocation/leverage/position size level then you should adjust your portfolio management rules to ensure that you can.
This is a great way to think about how much capital should you allocate to a system or to a market direction or to a suite of systems. For example, if you have all loan side trend-following systems and they’ve all got a maximum of 30% historical drawdown, then you know at some point in the future, you’re probably going to get a bigger than 30% drawdown. Maybe therefore you shouldn’t allocate all your money to those systems.
Using Monte-Carlo Simulation to Better Understand Maximum Trading Drawdown (MDD)
How do you determine the maximum likely drawdown based on your back-tested trading system? Well, the first thing you’re going to do is you’re going to backtest your system and see what you got in the backtest. As a general rule of thumb, as stated above, if you multiply the maximum historical drawdown by 1.5, then you’ll get an indication of how bad it really could get.
Of course, as a trader, you are going to hope it’s not going to get that bad, but it might. So you want to be able to survive that level of drawdown from your system.
There are some other tools that you can use because the shape of your equity curve in the past, in your backtest is determined by the sequence of events that happened in the past. But a different sequence of events could play out in the future.
The sequence of events in the future could be quite different… You could have this sequence:
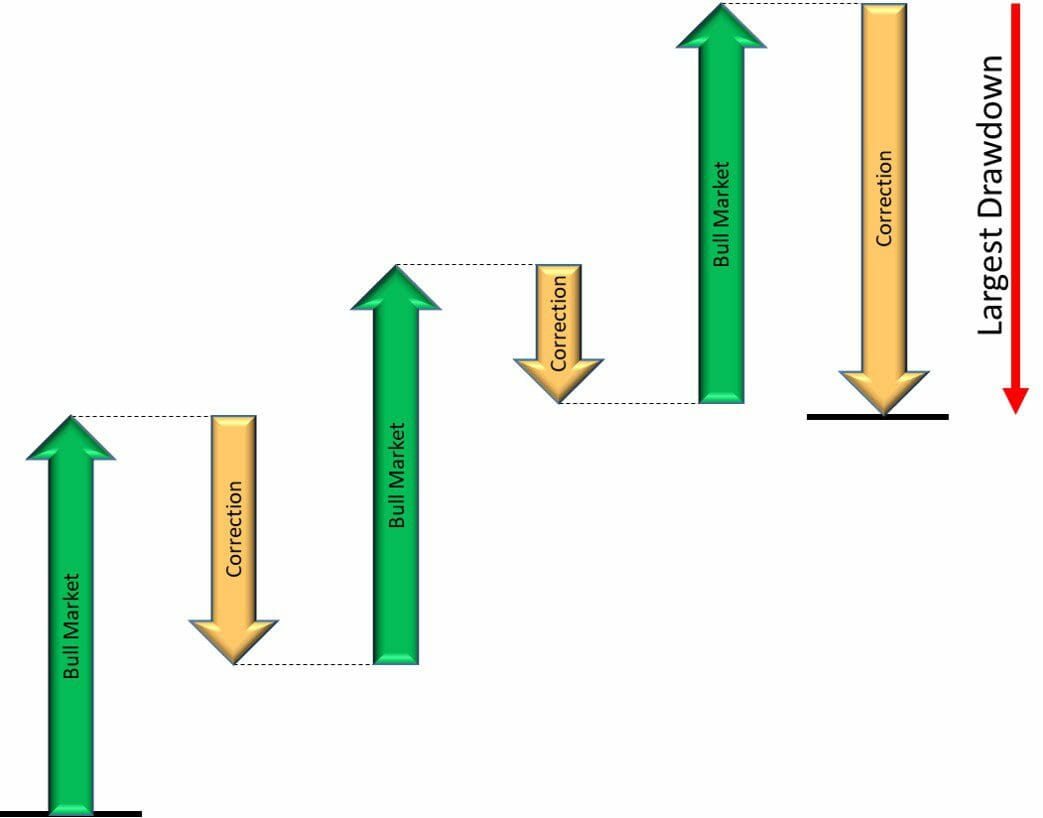
Or you could have a completely different order of market conditions like:

These are going to have completely different drawdown profiles even though the overall outcome is exactly the same, so how can you determine how bad your drawdown could get?
One thing you can do is run a Monte Carlo simulation on your equity curve. The functionality exists in AmiBroker to take your equity curve and reshuffle it. This is an advanced topic, which I teach in my advanced backtesting and trading system development course.
What Monte Carlo simulation of the equity curve allows you to do is randomly resequence the daily changes in your backtest equity curve to see how good or bad your system could get when the daily changes happen in a different, randomised order. When you do this analysis you can see how your portfolio equity curve might look with thousands of randomly generated sequences of trading days:

Within each of these thousands of simulations, the maximum historical drawdown will be different. So by analysing all of these equity curves you can get a probabilistic understanding of the range of possible max drawdowns from your trading system. This is illustrated by the probability distribution diagram below:

The above monte-carlo output shows that you have a 100% chance of having a drawdown of more than 23%… a 50% chance of having a maximum drawdown level of more than 30% and a 10% chance of having a max drawdown of more than 40%.
By doing the monte-carlo reshuffle of the equity curve you are asking how bad it could get if you re-sequence things. This is obviously a much deeper level of insight than just a single equity curve from one backtest.
Try and think, through different sequences of events, and different types of markets, what would this system do? Do that logically, and then do it with a Monte Carlo simulation.
The relationship between drawdown depth and drawdown duration
The next aspect of drawdown I want to talk about is the relationship between drawdown depth and drawdown duration (recovery window). There are some schools of thought that say the depth of the drawdown can be reduced, but that’s usually at the expense of suffering a longer recovery window. I don’t necessarily think this is a hard and fast rule, but there is definitely a trade-off between the drawdown depth and recovery window.
For example, let’s say you turn off your system when the market starts dipping and you turn it back on when the market is rallying; you’re going to have a long, shallow drawdown. But if you don’t turn off your system when the market is dipping, you may have a big drawdown. But then when the market rallies, you’re going to recover more quickly. So the trade-off is a short, deeper duration versus a longer, shallow drawdown.
This is a trade-off that you can investigate further once you have learned how to backtest and optimize your trading systems using the skills that I teach in The Trader Success System. When you are backtesting different ideas to reduce your max drawdown you need to think about the impact on both depth and duration of drawdown and monitor the impact of each on your system performance.
This is the reason why often turning a system off and on again, based on the market’s behavior is sometimes not that helpful because you just end up with a really long, slightly shallower drawdown. In some cases you can get better compounding if you don’t turn the system off, you just trade through the drawdown and you get out of the other side to new equity highs more quickly.
A lower maximum drawdown level is not necessarily better if it’s twice as long!
So think about drawdown depth and duration and observe these when you make changes to your systems and that will help inform your decisions on how to improve the trading system.
When it comes to reducing drawdowns, there is also frequently an unfortunate tradeoff between the biggest drawdown level and overall profitability. Often when you try to improve one of these areas, the other one will suffer.
For example, if you attempt to reduce your biggest drawdown by adding a market regime filter, the depth of the drawdown will often be improved, but because the market regime filter takes you out of the market for a longer period, it also takes you longer to get out of the drawdown and you may end up making less money overall. Reducing the maximum drawdown level will often (but not always) reduce the expected profit of your system.
You can try to reduce the recovery window by adding more rules and parameters or by allowing the system to reenter the market more quickly, but this may result in a deeper drawdown level and lower expected profits. So, it is important to remember that trying to reduce drawdowns will sometimes come with a cost in terms of longer drawdowns or lower expected profits.
This tradeoff does not always hold true, sometimes you can improve a trading system and get lower drawdowns, shorter drawdowns and higher profits – so this is absolutely worth aiming for, but it is sometimes harder to achieve than we would like.
How do you turn off a trading system to reduce drawdown?
You could introduce a new trading rule in your system to turn the system off if the market was in an unfavourable condition. This should be a systematic/objective rule and not a subjective judgement. A simple example could be to only buy if all of your buy rules are in place AND the index is above the 200 day moving average. Plus if the index drops below the 200 day moving average then you close all your positions. This basically means the system is ON if the Index is above the 200 day moving average and it is OFF if the index is below the moving average.
This sort of index switch/market regime filter sounds like a good idea, and sometimes it is, but sometimes it is not a good idea. You have to backtest it and evaluate the rule objectively by looking at the drawdown depth and the drawdown duration of the two scenarios and decide, which is best.
The causes of drawdown in stock trading systems:
There are several big factors that cause drawdowns in your stock trading systems. When you run a backtest and you find that the maximum historical drawdown is too big, you need to figure out which of these causes is the problem so that you can go and address the correct cause to make the system better.
Experiencing a long string of losing trades
The first possible cause is a long string of losses. Many losing trades in a row are caused by an entry signal that’s out of sync with the market or is no longer working. If you get many losing trades in a row, you can definitely go into drawdown and it can hurt your trading system profitability.
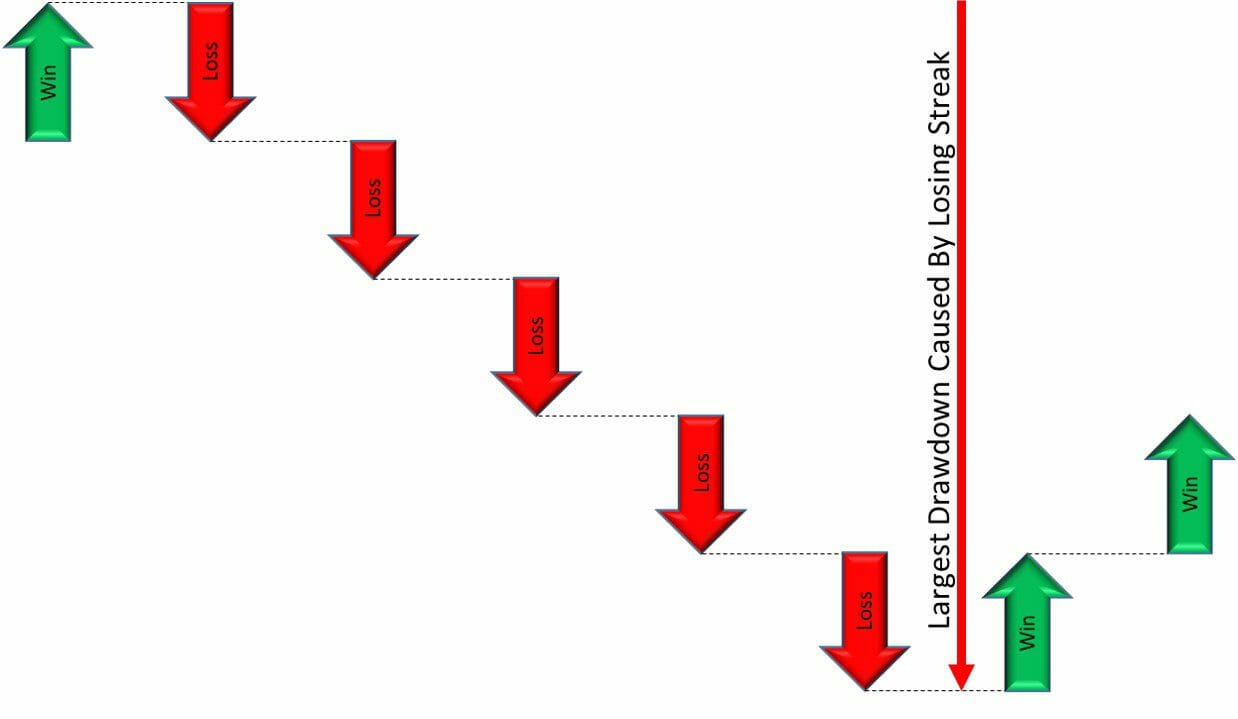
So sometimes improving the drawdown or reducing the drawdown is about making the entries trigger more accurate to reduce the length of the longest losing streak.
A broad market correction can push all stocks down and cause a drawdown
The second potential cause of drawdown, which is fairly common, is a broad market correction, which has all of your stocks against you. Let’s say you’re predominantly a long-side trader and the market dip suddenly all goes into a sudden unexpected bear market (Hello coronavirus?!?!). Then that will push all of your positions down, which will cause a drawdown. This is probably one of the most common ones where you’re basically heavily invested on the long side. You’re therefore subject to the whims of the market.
So how do you deal with that?
Reducing this sort of drawdown is about identifying when a market dip is happening and trying to create a rule that will get you out or get you out of the weakest trades, or stopping your system from taking new trades. You don’t necessarily have to turn the system off, but if the market starts dipping then stocks that have a high beta fall faster, and then you probably want to get out of those. However, some stocks might hold up and actually not be worth selling because as soon as the market starts to recover they sort of take off again. This is something that you should backtest to find the best course of action objectively.
Inefficient exits causing a large difference between Maximum Favourable Excursion and Final Trade Profit
The third cause of drawdown, which is actually surprisingly common is a hugely profitable trade, which falls a long way from its peak to the entry price.

So this is where the comparison between the maximum favourable excursion of the stock and the ultimate profit of the trade becomes important. When you run your backtest, you can sort on the maximum favourable excursion and compare the MFE to the percent profit per trade and see if there’s a big disconnect. If there’s a big disconnect, can cause higher drawdowns than you’d like. This is a sign for you to look at the efficiency of your exit and see if you can design a more efficient exit to capture more of the MFE in these large moves. This is a great way to improve your profitability and reduce your system drawdown at the same time.
Entries which buy into weakness when the broad market is falling
The fourth common cause of large drawdowns which is typical for mean reversion systems are entries that buy into weakness, that keep buying when the broad market is falling. For some mean reversion systems, that can be a serious problem. The more selective the entries of your mean reversion system, the less this is a problem.
If you have a very generic oversold entry for your mean reversion trading system that is easily triggered and generates lots of trades, chances are at some point when the market rolls over, you’re going to get fully invested in one day, then get stopped out, then get fully invested the next day, then get stopped out, then get fully invested the next day, then get stopped out. When this happens you will find yourself in a big drawdown hole, a big one.
The solution to this problem is to backtest more selective entries and ensure that your system does not keep entering immediately after being stopped out.
How to reduce your trading system’s maximum drawdowns
Reducing your trading system’s maximum drawdown comes down to an investigation and hypothesis generation exercise. You need to look at the backtest statistics and the equity curve to figure out which of these causes is really the problem with your trading system. Then come up with rules to mitigate it in the particular situation that your trading system is in.
In particular, you can look at the following potential solutions to the drawdown problem:
- Improve your entry trigger to reduce the length of the longest losing streak
- Test a market filter for both entries and/or exits
- Look at the maximum favourable excursion profile of your backtest and see if you can make a more efficient exit that captures more of the profits
- Refine your mean reversion entries to ensure they do not buy into a market-wide correction
- Ensure you are not buying and getting stopped out and buying again (eliminate this by enabling a re-entry delay in your trading system rules)
Investigate the causes of the large historical drawdowns and find the issue that is causing the drawdown that you’re uncomfortable with. Then generate hypotheses to address that and then test them one at a time and see if they improve the situation. That’s how you reduce drawdown in a structured way.
What you shouldn’t do is just throw indicators into your system and randomly backtest them to see if they reduce the drawdown!
Have a look at the system, have a look at the backtest performance, have a look at the equity curve, and figure out which issue is causing the drawdown and it will point you to which part of the system needs to be addressed.
How to Think About Drawdowns in Mutual Funds
When investing in mutual funds, it’s important to understand the concept of drawdown and how it can affect your portfolio. The definition of drawdown is the same for mutual funds as it is for trading systems – The percentage drop from equity peak to the subsequent valley.
It is important to compare drawdowns among different mutual funds with the same investment mandate before making an investment decision because this will give you insight into how much risk each fund is taking on and how well they are able to manage that risk. Assuming returns and all else is equal, mutual funds with the lowest historical drawdown are likely to be the better investment.
Conclusion on Drawdowns in Trading
Drawdowns are an unavoidable aspect of trading and we will never fully avoid them. the most important thing is that we understand the maximum drawdown level of our trading systems and our portfolio as a whole through backtesting, and ensure this is consistent with our trading goals.
Of course we don’t have any guarantees about the future returns or future drawdowns that our strategies will experience, but if the historical return and drawdown profile is stable then this can give us a good level of confidence that our trading strategy will continue to perform well in future.
If you want to learn how to objectively and systematically evaluate your trading rules, and become a profitable and consistent systematic stock trader then click the button below to learn more about The Trader Success System – It will change the way you think about trading and transform your results!
More Articles About Drawdown in Trading
We have written a number of other articles and videos which will help with your understanding about managing drawdown in trading and improving your trading system results by reducing drawdown:
- How does Amibroker measure the maximum historical drawdown of a trading system in the backtest?
- How do you decide to exit your trades if you are in a drawdown?
- How to think about drawdown when combining multiple trading systems in a portfolio
- What to do when your trading system hits your maximum drawdown
- How to Set achievable CAGR & Drawdown targets for stock portfolio
- 2 Methods to Launch New Trading Systems & Manage Initial Drawdown
- When Should I Switch Off A System?
- Are your trading system rules still working?
- Should I go live with a long-only stock trading system when a market correction is expected?
- How can I overcome my fear of taking action when trading stocks?
Do you have any questions about how to manage and reduce the maximum drawdown from your trading system? Comment below and I will help you out 👇👇👇


Thanks for the depth and breadth of this article. It contains a lot of information that every trader should pay very close attention to.
After reading this article, I conducted Monte Carlo simulations on my systems and changed the capital allocation and leverage of all of them because of the drawdown they are likely to encounter at some stage. Before I focused more on return.
Very useful content.
Hi Stephan,
Thank you for your fantastic comment. I am glad that my article on managing your trading drawdown has helped you. Your approach to running Monte-Carlo backtesting simulations to understand the range of possible drawdowns is excellent and I am really glad that you have taken action and reduced your capital allocation and leverage in your trading systems to better manage your max drawdown in the future – well done!
Adrian
Thanks Adrian – the systematic trading journey rolls on – excellent info ! Hope to get a step by step on how to do a monte-carlo on “the simple system” to see its outliers – looking forward to new insights- enjoy the day 🙂 Matty
Hi Matt,
Thank you for your comment and for sharing your progress – You are doing really well in the System Trader Launchpad program! I will be covering Monte Carlo analysis in an upcoming advances trading system development course really soon, so watch out for that – It’s going to be awesome!!!
Adrian
Excellent article! Very helpful as are all of Adrian’s info.
Thank you for reading Doug – I am glad you found my article on the causes of trading drawdown and how to address it helpful.
Adrian
Pretty nice post. I just stumbled upon your blog and wanted to say that I’ve truly loved surfing around your posts.
In any case I will be subscribing for your feed and I’m hoping you write once more
soon!
Thank you – I am glad you found my post about the causes of trading drawdown and how to reduce it valuable!
Adrian
I every time spent my half an hour to read this weblog’s posts every day along with a cup
of coffee.
Thank you Willian – I am glad you are enjoying the content 🙂 Let me know if you have any Trading Questions about reducing your drawdown or improving your returns and I will do my best to help you out.
Adrian
Great article! Thanks for explaining in depth.
Is it possible to do monte-carlo in terms of R-multiple maximum drawdowns instead of % maximum drawdowns?
Hi Pranesh,
Great question about Monte-Carlo analysis. The R-Multiple approach to Monte Carlo is only possible really if you are using a single instrument system. For a portfolio system (like when you trade a portfolio of stocks with one system) you can’t meaningfully do R-Multiple monte-carlo simulation because you need to capture the portfolio interaction effects which you can only do with an equity curve reshuffle monte-carlo backtest.
Adrian
Hi there to all, the contents existing at this website are really remarkable for people knowledge, well, keep up the good work fellows.
Thank you for reading my articles! I hope they help you with your trading journey 🙂
Nice article, also applicable to other markets. I do forex myself. How about countertrades if the equity falls below the balance with a certain percentage? The prop firms I talk to demand a max DD of only 5%, including open positions. Exit at breakeven.
Hi Fredrik,
Low drawdown like this would be a common requirement for prop firms. They also would generally expect much shorter term trading than what most regular traders can do when they are working a day job. I think the important thing for every trader is to think about what their objectives are (some may be externally imposed like you are suggesting) and then find a trading strategy that fits within those objectives.
I talk a bit more about trading objectives in this post about why your trading objectives are so important and in this article about setting your trading system goals.
Thanks for taking the time to comment and share your thoughts – Very much appreciated.
Adrian
I wanted to understand MAE and MFE better. I thought this is the first place to check and I wasnt dissapointed. I will reread this article and incorporate the points made into my backtest plans.
Thanks Adrian.
Hi Kevin,
Brilliant! So glad you found the article helpful and you are continuing to expand your knowledge of trading. Thank you for taking the time to comment! I love hearing from readers 🙂
Adrian
How much max drawdown do you personally like to target? For me I build for -10%, knowing very well it could end to -15% to -20% if something unexpected and nasty happens.
Hi Izzy,
Thanks for your question – This really is mostly to do with the individual trader’s risk tolerance. My personal drawdown tolerance is 30%, however when I design the portfolio I will take into consideration that my worst drawdown is ahead of me so that I don’t exceed this level.
Adrian
HI, Adrien, congrats for your detailed article about the drawdown risk issue.
I think I am also an experienced trader, managing my own capital in a way that optimizing all the backtest trading systems included in the portfolio, and adjusting them in small twicks for the real time results, you can achieve outstanding performances, based on trading a variable set of contracts of the S&P 500 (US 500 CFDs) analysing simultaniously 8 different time-frames (1W, 2D, D, 4H, 2H, 1H, 30M and 15Minutes) with the same trading systems.
So I would share with you several conclusions from my personnal research in the drawdown field:
1) Your MDD depends not only from the drawdowns of the isolated trading systems you are using but it depends from the set of the correlation of all the trading systems set.
I suggest using 4 different groups of trading systems, mostly not correlated, so you can reduce the future overall drawdowns: standard trend following, mini-trend following, convergence/divergence indicators and oscillators or swing indicators.
In my personnal case I have for each of them, in the real market trading conditions, a profit/risk ratio of 2.5, 2.0, 1.75 and 1.45 .
Someone could argue why using for instance the groups of the convergence/divergence and oscillators if they aren’t so performing?
The answer is quite obvious: the first group signalling sells after some nice rallies is the convergence / divergence, when the momentum starts decreaing, generally in scenarios in which the portfolio leverage is near the maximum level, so the risk of adverse excursions for all the trend indicators is quite high.
So you start to decrease gradually your leverage in the small time-frames. Then the oscillators follow the path, although I have a cautious rule: I do never never enter a swing trading sell signal if the 3 time-frames above have a buy trend signal, in that case pass the swing trade signal, your wealthy portfolio will appreciate the future outcomes.
Anyway adjust your risk or number of buy or sell contracts according with your historical performance of each group of trading systems.
2) Your MDD will also depend of the average historical volatility of your portfolio assets, surely trading the S&P index will assure you less risk than a portfolio with several hot stocks from Nasdaq for sure.
3) Finally I would stress an important point: the future expected maximum drawdown depends largely of the estimated period that you are planning to trade according with the rules you are using for the trading systems.
I have conducted an extensive research and I can assure you that the future maximum drawdown has a confidence interval of 90% of being, till the end of your projected time trading limit, inside this safety final expected future maximum drawdown:
Square root of ( Total expected period to trade / Total period of time traded since the portfolio start) x (3 x bigger drawdown occured in real time since the beggining + 2 x the second bigger drawdown in real time + the third bigger drawdown in real time) / 6
Thank you for your time of patience for reading this, hope you enjoy it and best wishes of successes for your trading job and results.
Hi Nuno,
Thank you for taking the time to share your great comment – I very much appreciate it. You have some great thoughts here and it sounds like you have a brilliant approach to portfolio construction and diversification – well done! Thanks also for sharing your approach to calculating the future maximum drawdown – I will give that some thought as I haven’t considered estimating it that way before. I like to look at the monte carlo simulation of the combined equity curve and think about the drawdown in probabilistic terms based on those results.
Thanks again for reading and taking the time to share your insights.
All the best with your trading!
Adrian