Mean reversion trading is a popular and profitable trading strategy that can be applied to many different financial markets. Mean reversion is the tendency for something to move or oscillate around some average or mean and revert to that mean. And so, if you look at a stock chart, you’ll often see a trend that happens, a primary trend either up or down, sideways, or around that trend; the price oscillates or fluctuates. Mean reversion is the tendency for it to move below that trend and then bounce back to the average or move above that trend and spring back down to the average.

Looking at the chart of the S&P 500 Index from the US Stock Market above, you will see I’ve just got a 20-day exponential moving average drawn in this chart in red, and then you can see the red down days, the green up days. If you look at the price, the price tends to move above the average and then snap back in an uptrend and bounces back. And then in a downtrend, it moves down and intends to snap back, then moves down again, and tends to snap back. This is what we talk about as mean reversion.
You can create a system around this concept of mean reversion, you can get a high win rate in your system and generate relatively smooth returns because reversions of the mean are very reliable. It happens constantly because stock prices are always oscillating around the primary trend. So if you can capture that, you can generate a great trading strategy.
How Mean Reversion Trading Strategies Work
Think about an elastic band — we know that stock prices tend to move in trends, but those trends are not a straight line. The price will oscillate above and below the trend, and when the price moves below the trend, it’s like an elastic band being stretched which tends to snap back. When the price moves above the trend, it’s like the elastic band being stretched in the other direction, and it will tend to snap back. This is precisely the behaviour that your mean reversion trading strategy is looking to capitalize on.
There is a real edge in mean reversion because trends move in waves rather than straight lines. This is ubiquitous behaviour that you can see on pretty much any chart. The trick with a mean reversion trading strategy is to know when the elastic band is stretched above the trend enough to go short and when it is stretched below the trend enough to go long… plus when is it safe to trade mean reversion on the long side vs on shorting a stock that is overbought.
Example Mean Reversion Trades using Relative Strength Index
What I want to demonstrate now, is a simple set of indicators that give you a feel for how these trading strategies work on the chart. In concept, we’re going to sell short when it’s overstretched above the trend, and we’re going to buy when it’s overstretched below this trend. But when does that happen? One of the simplest and most common indicators used for mean reversion trading strategies is the Relative Strength Index (RSI).
I’ve got a chart of the S&P 500 index and plotted underneath it is the two-period RSI. The two-period RSI is beneficial for mean reversion because it identifies very short-term periods where the price is oversold or overbought. Shown on the chart is a period where there’s been a downward trend in the S&P. I’m determining the downtrend, looking at a long-term moving average, a 200-day exponential moving average, and a 20-period exponential moving average. There’s no magic in these exact numbers, however, it’s a downtrend when the short-term moving average is below the long-term moving average.
To get an edge in your mean reversion trading strategy, you want to ensure that you are trading in the direction of the primary trend. In the case of the chart shown previously, the primary trend was down. Thus, we’re going to be looking for opportunities to go short. If the primary trend were up, we would look for opportunities to go long. On the chart below, if the primary trend is down, we want to find areas where the price is overextended up and ready to snap back. Just like our elastic band, when the trend is down, we’re looking for it to be overextended up, and we’re looking for it to snap back.
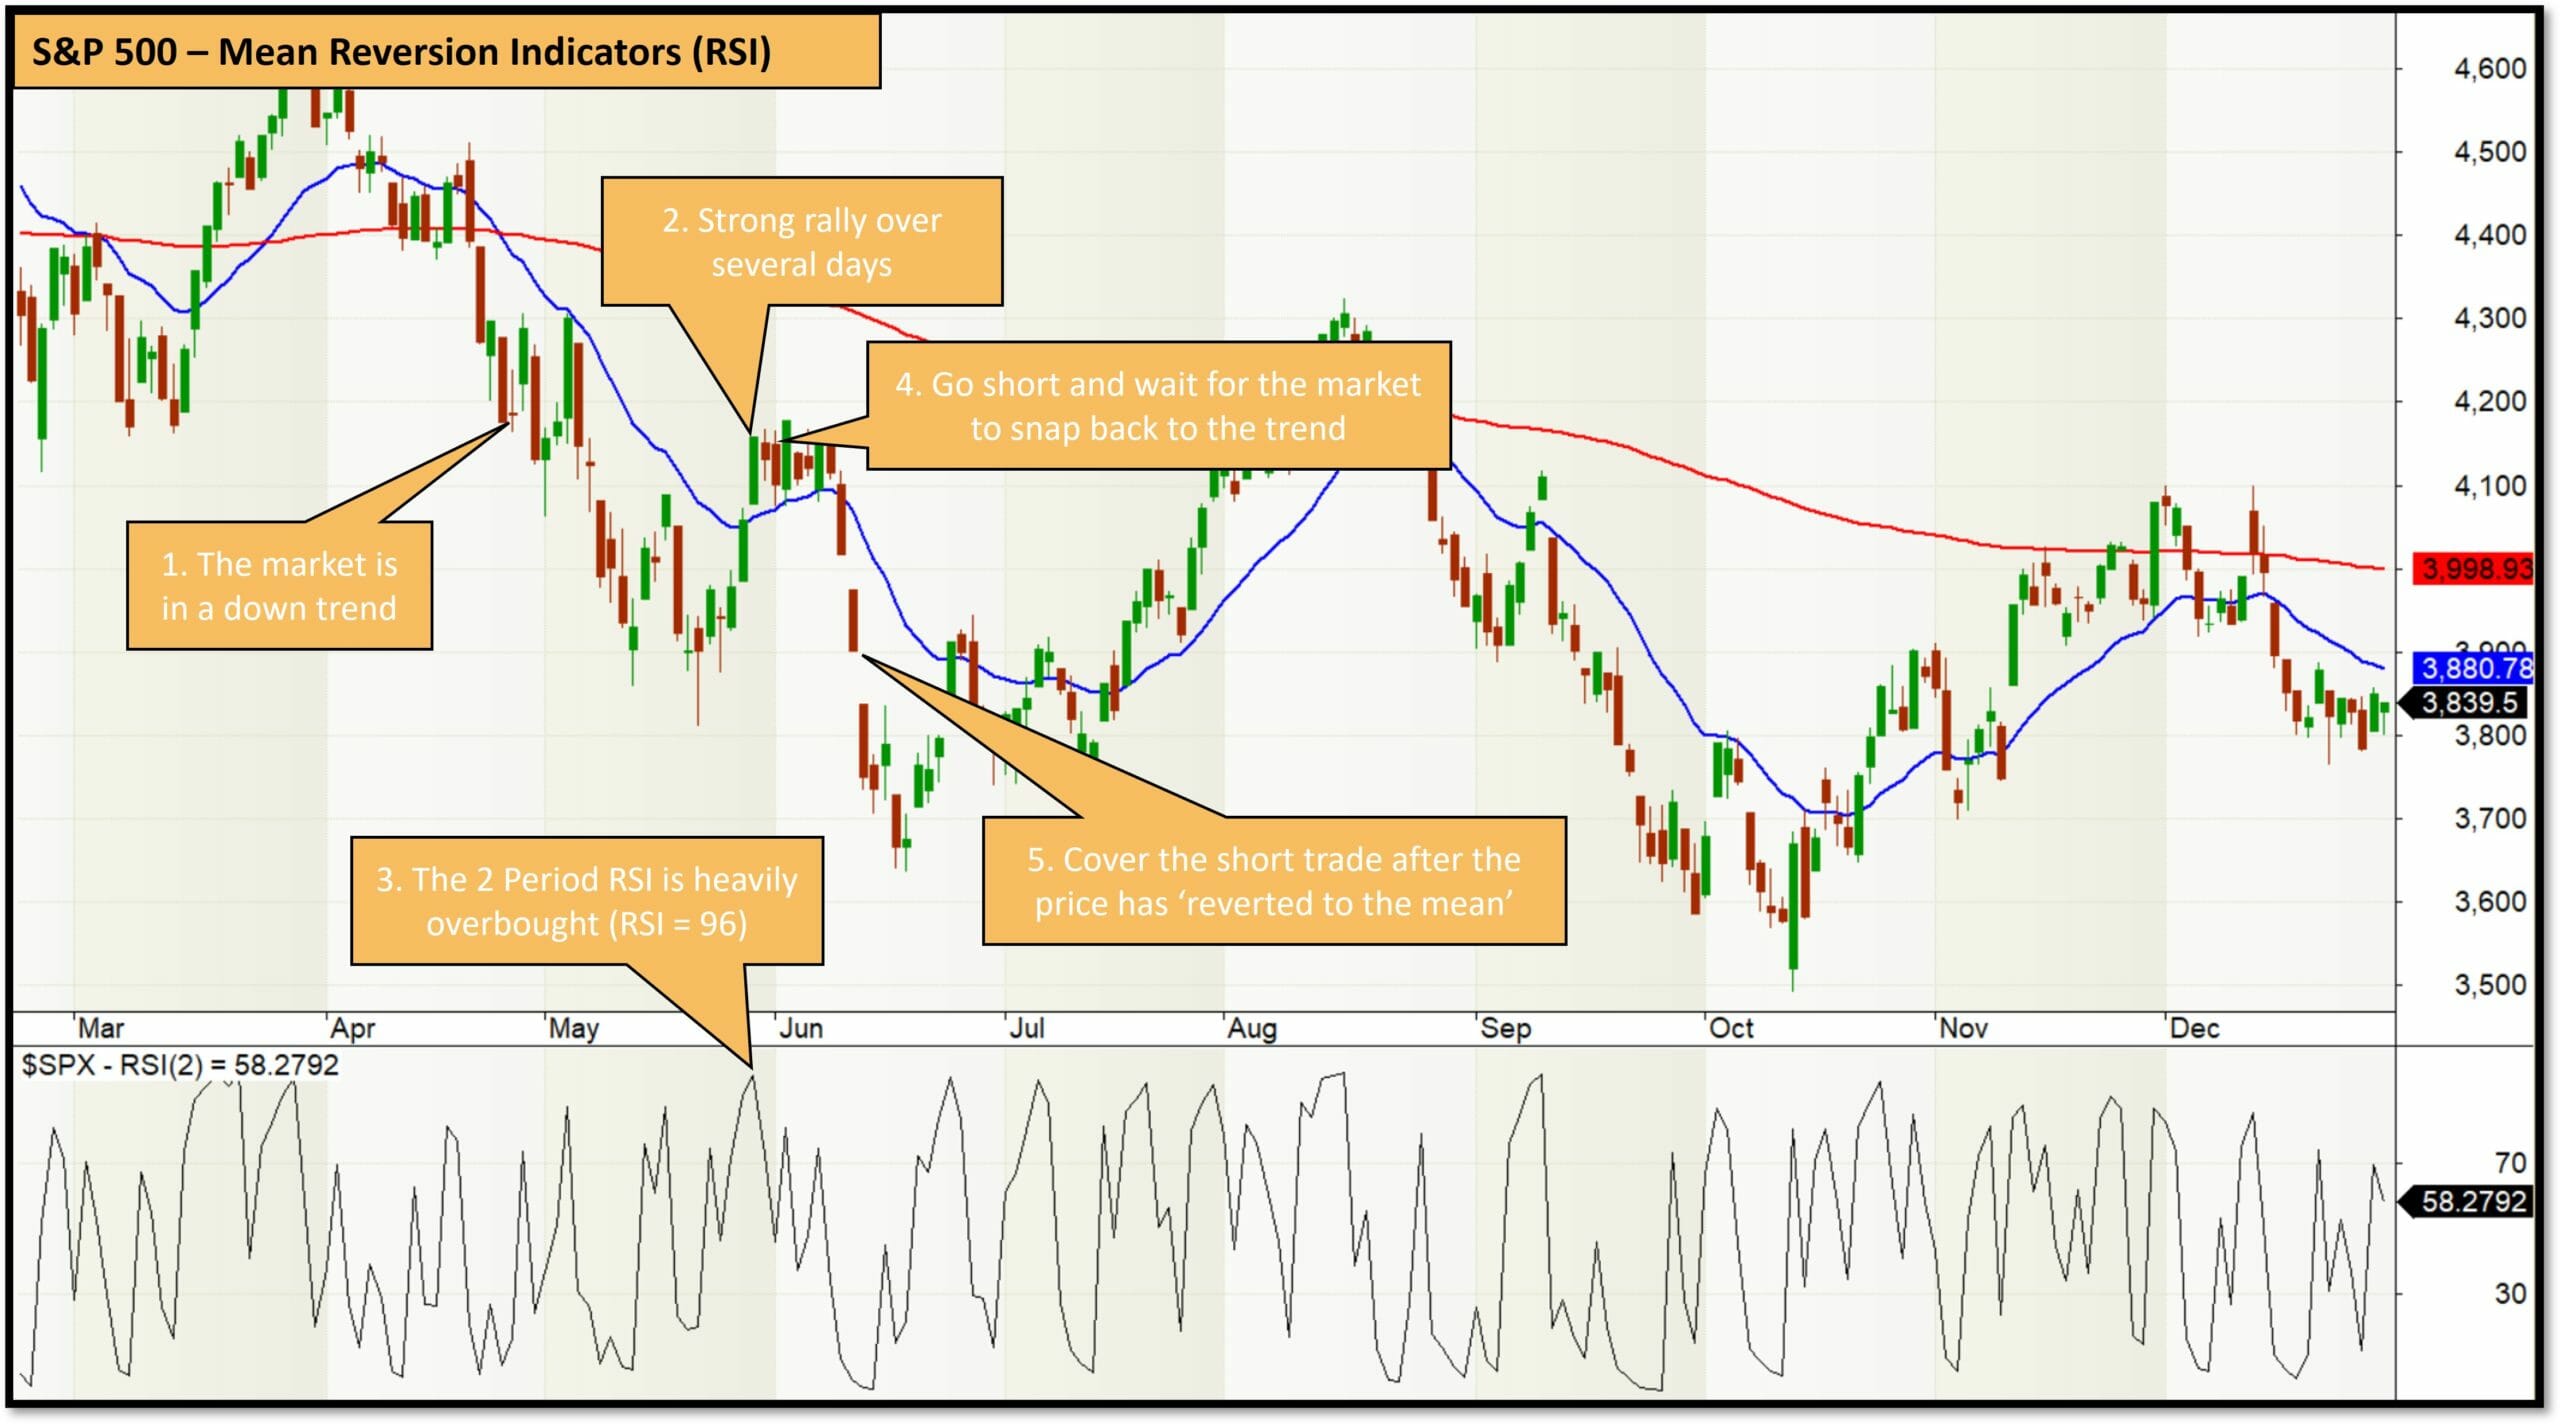
Here is a perfect example of what we’re looking for in mean reversion trading strategies on the chart of the S&P 500 Stock Market Index below. The price has moved down quite strongly, found a base, and then rallied quickly over three days, all the way back above the 20-period exponential moving average. After that, it consolidated for a bit and collapsed back down in the direction of the trend.
So how do we identify this sort of move in real time?
Have a look at the two-period Relative Strength Index (RSI) at the bottom of the chart. To go short the market using a mean reversion strategy we are looking for a point on the chart where there’s a downtrend in place, and the two-period RSI is extremely overbought. That means the price has rallied heavily, for over a short period of days, to a point where it’s now very overbought and much higher than it has been in the recent past. At that point, in a downtrend when there’s been such a strong rally, it’s very likely for that to experience a reversion to the mean, and you can make a profit by going short.
On the chart above (3), you can see that the RSI two got to a value of 96, which is highly overbought because the price rallied very strongly over three days up to this level. At this point, in the downtrend, it’s overboard and very likely to snap back down. Therefore, you could short-sell there and then hold in anticipation of this subsequent decline and then take profits somewhere in this move as shown in points (4) and (5) on the chart.
This is how a mean revision trading strategy works. Identify the primary trend, find a period where there’s been a short-term move against the primary trend, get in your trade in the direction of the primary trend, wait for the correction back to the trend, and then get out.
Mean reversion is a short term trading strategy – Holding period is typically 1-5 days on daily charts
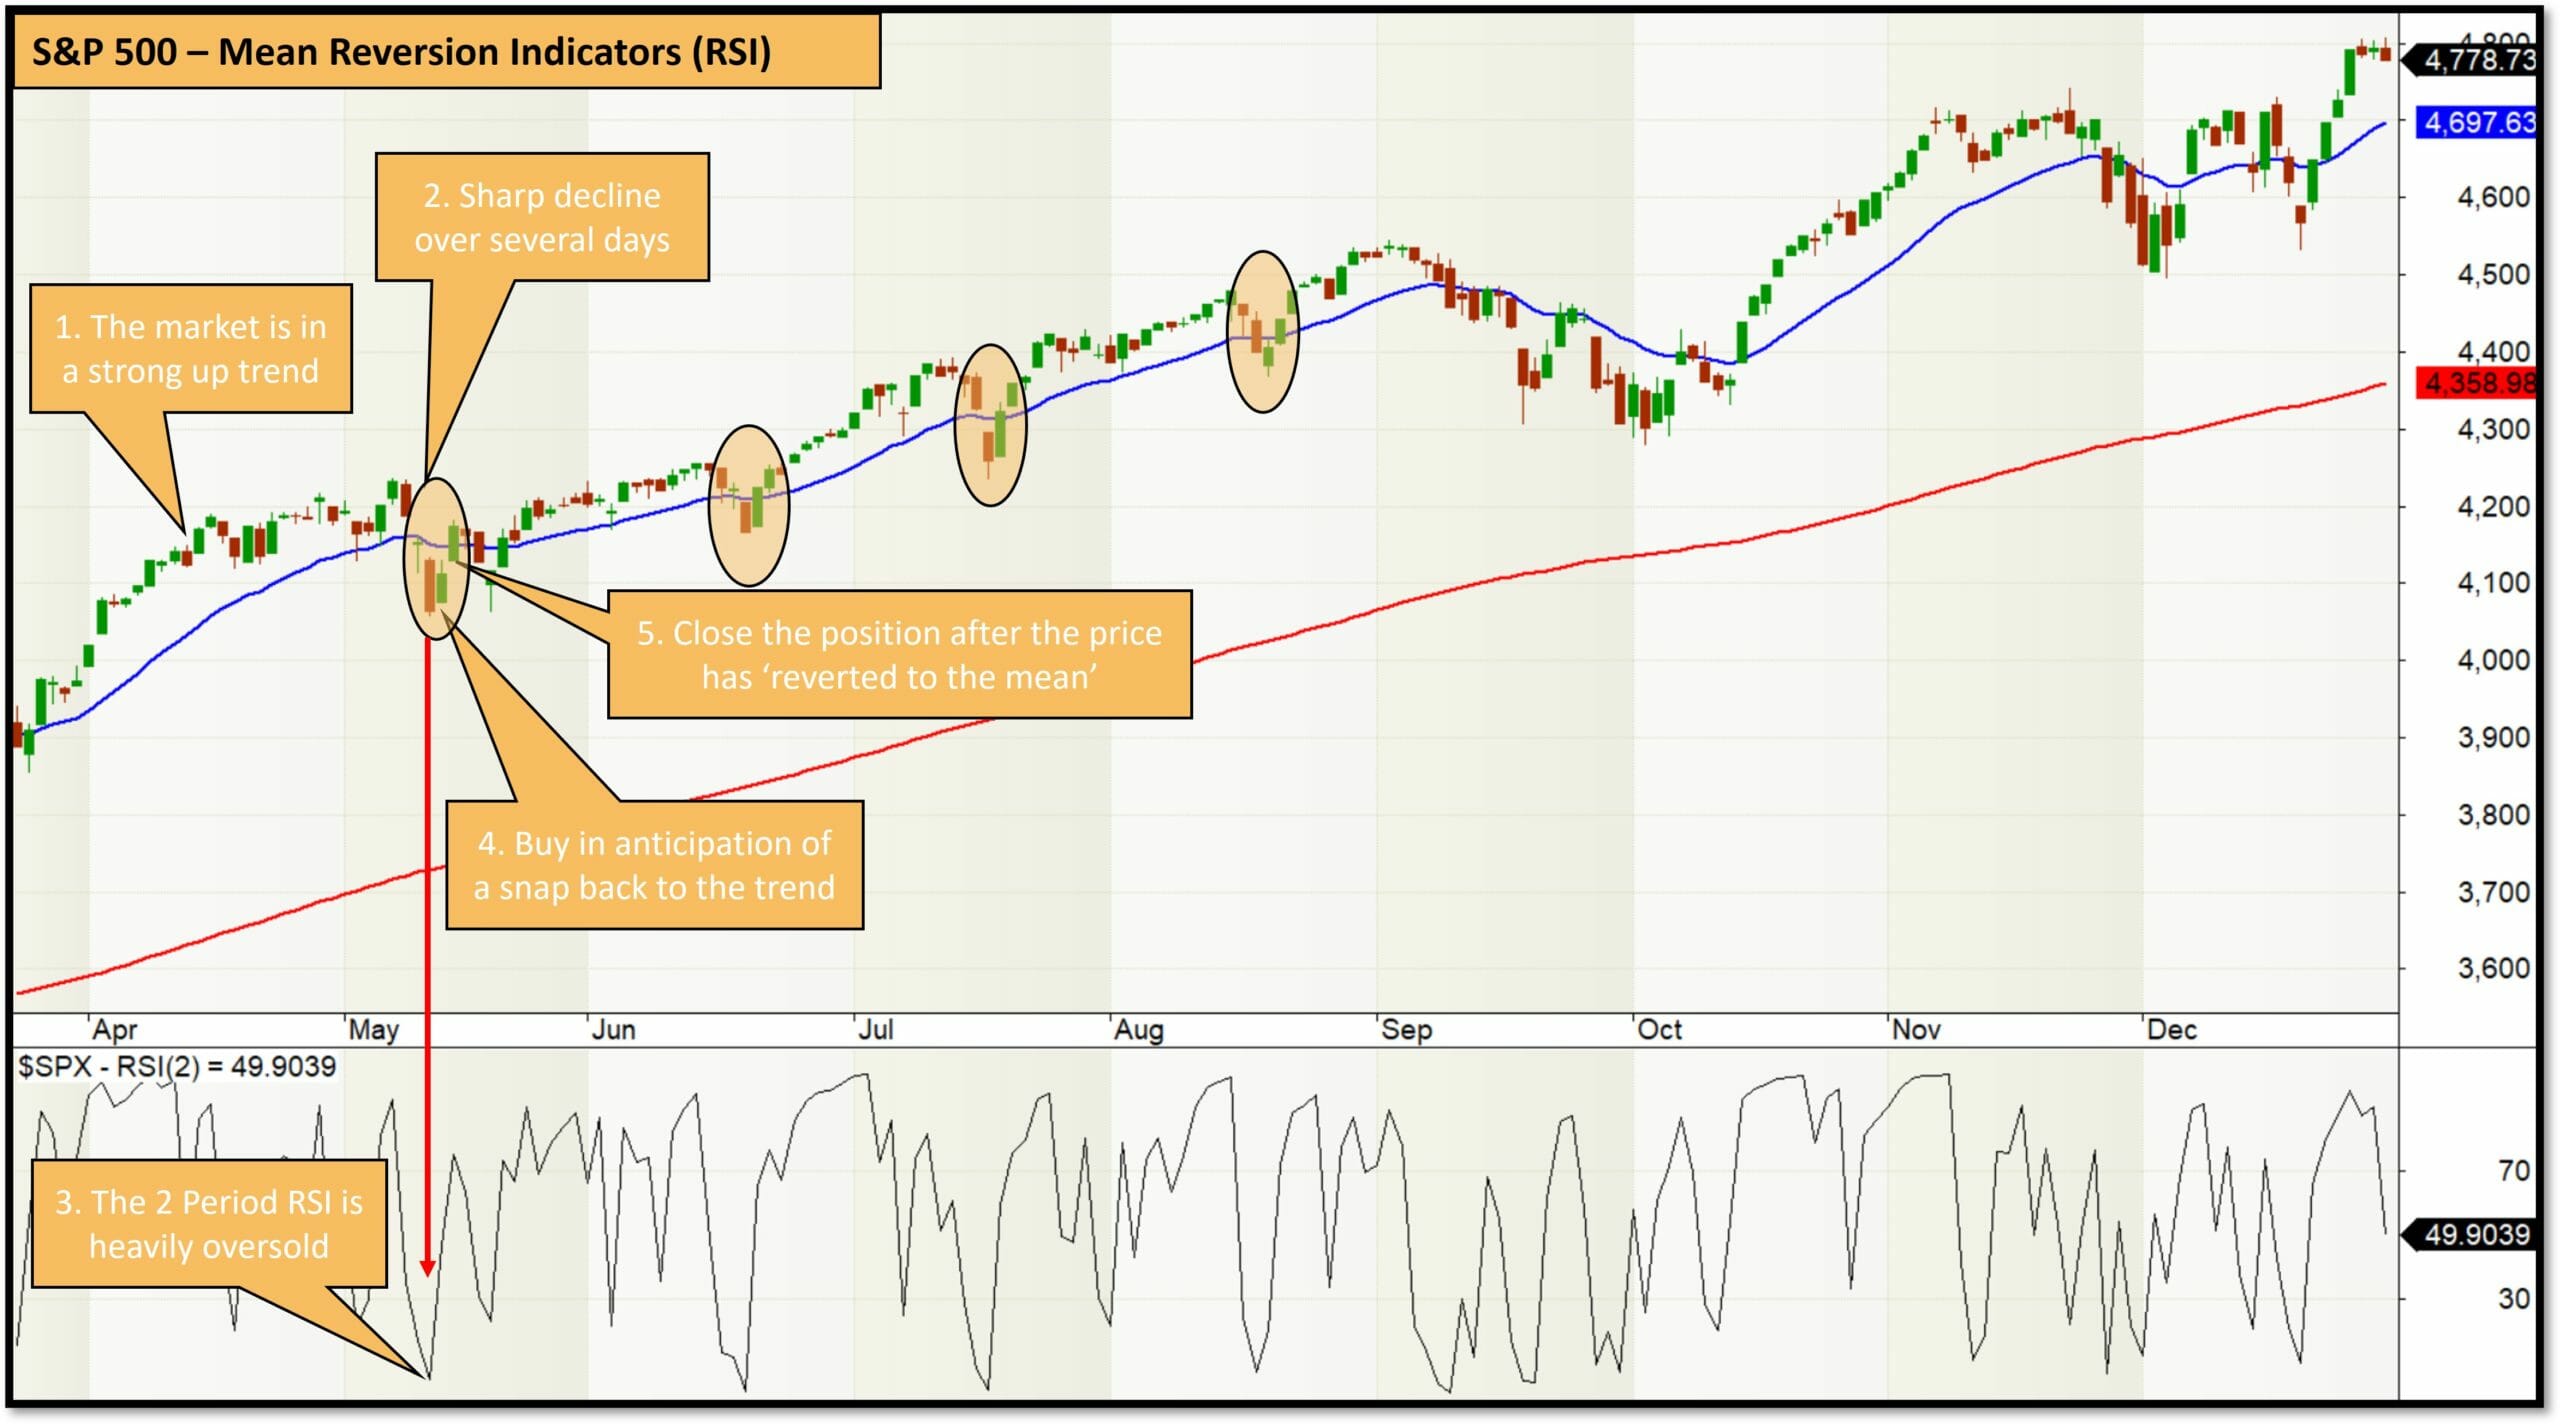
The chart below illustrates another example on the S&P 500 Index. There has been a solid rally, and the index is well above the 200-period moving average; you can see these little dips circled on the chart. Wouldn’t it be cool if we could buy these up at the bottom of these dips and then benefit from the subsequent rally? This sort of trading can give you excellent short-term profits.
If we look at the chart below, we can see that while it’s in an uptrend, the RSI two got down to as low as 1.7, which is quite oversold. If you had a signal to buy that instrument when the RSI two dropped below 1.7 or 1.8, and you just bought it then and held until the price rallied one or two days, then you’re going to capitalize on this sort of move. Therefore, we’ve got strong down movement, you get in and then have a couple of days of rally. The same thing happened on the others.
Mean reversion trading relies on these components:
First, identify the primary trend
Second: Find an overbought or oversold condition, enter in the direction of the primary trend
Third: Exit several days later or one to three days after the move has snapped back in the direction of the primary trend.
That’s how mean reversion trading works. If you want to develop a mean reversion trading strategy, you need those components.
The components of a mean reversion trading strategy.
First, I want to make sure you think about mean reversion trading as a complete system to get you into and out of the market. Mean reversion differs slightly from other trading strategies in how you combine a system’s various components.
What is a complete trading system?
The diagram below is a framework that I use to define a complete trading system.
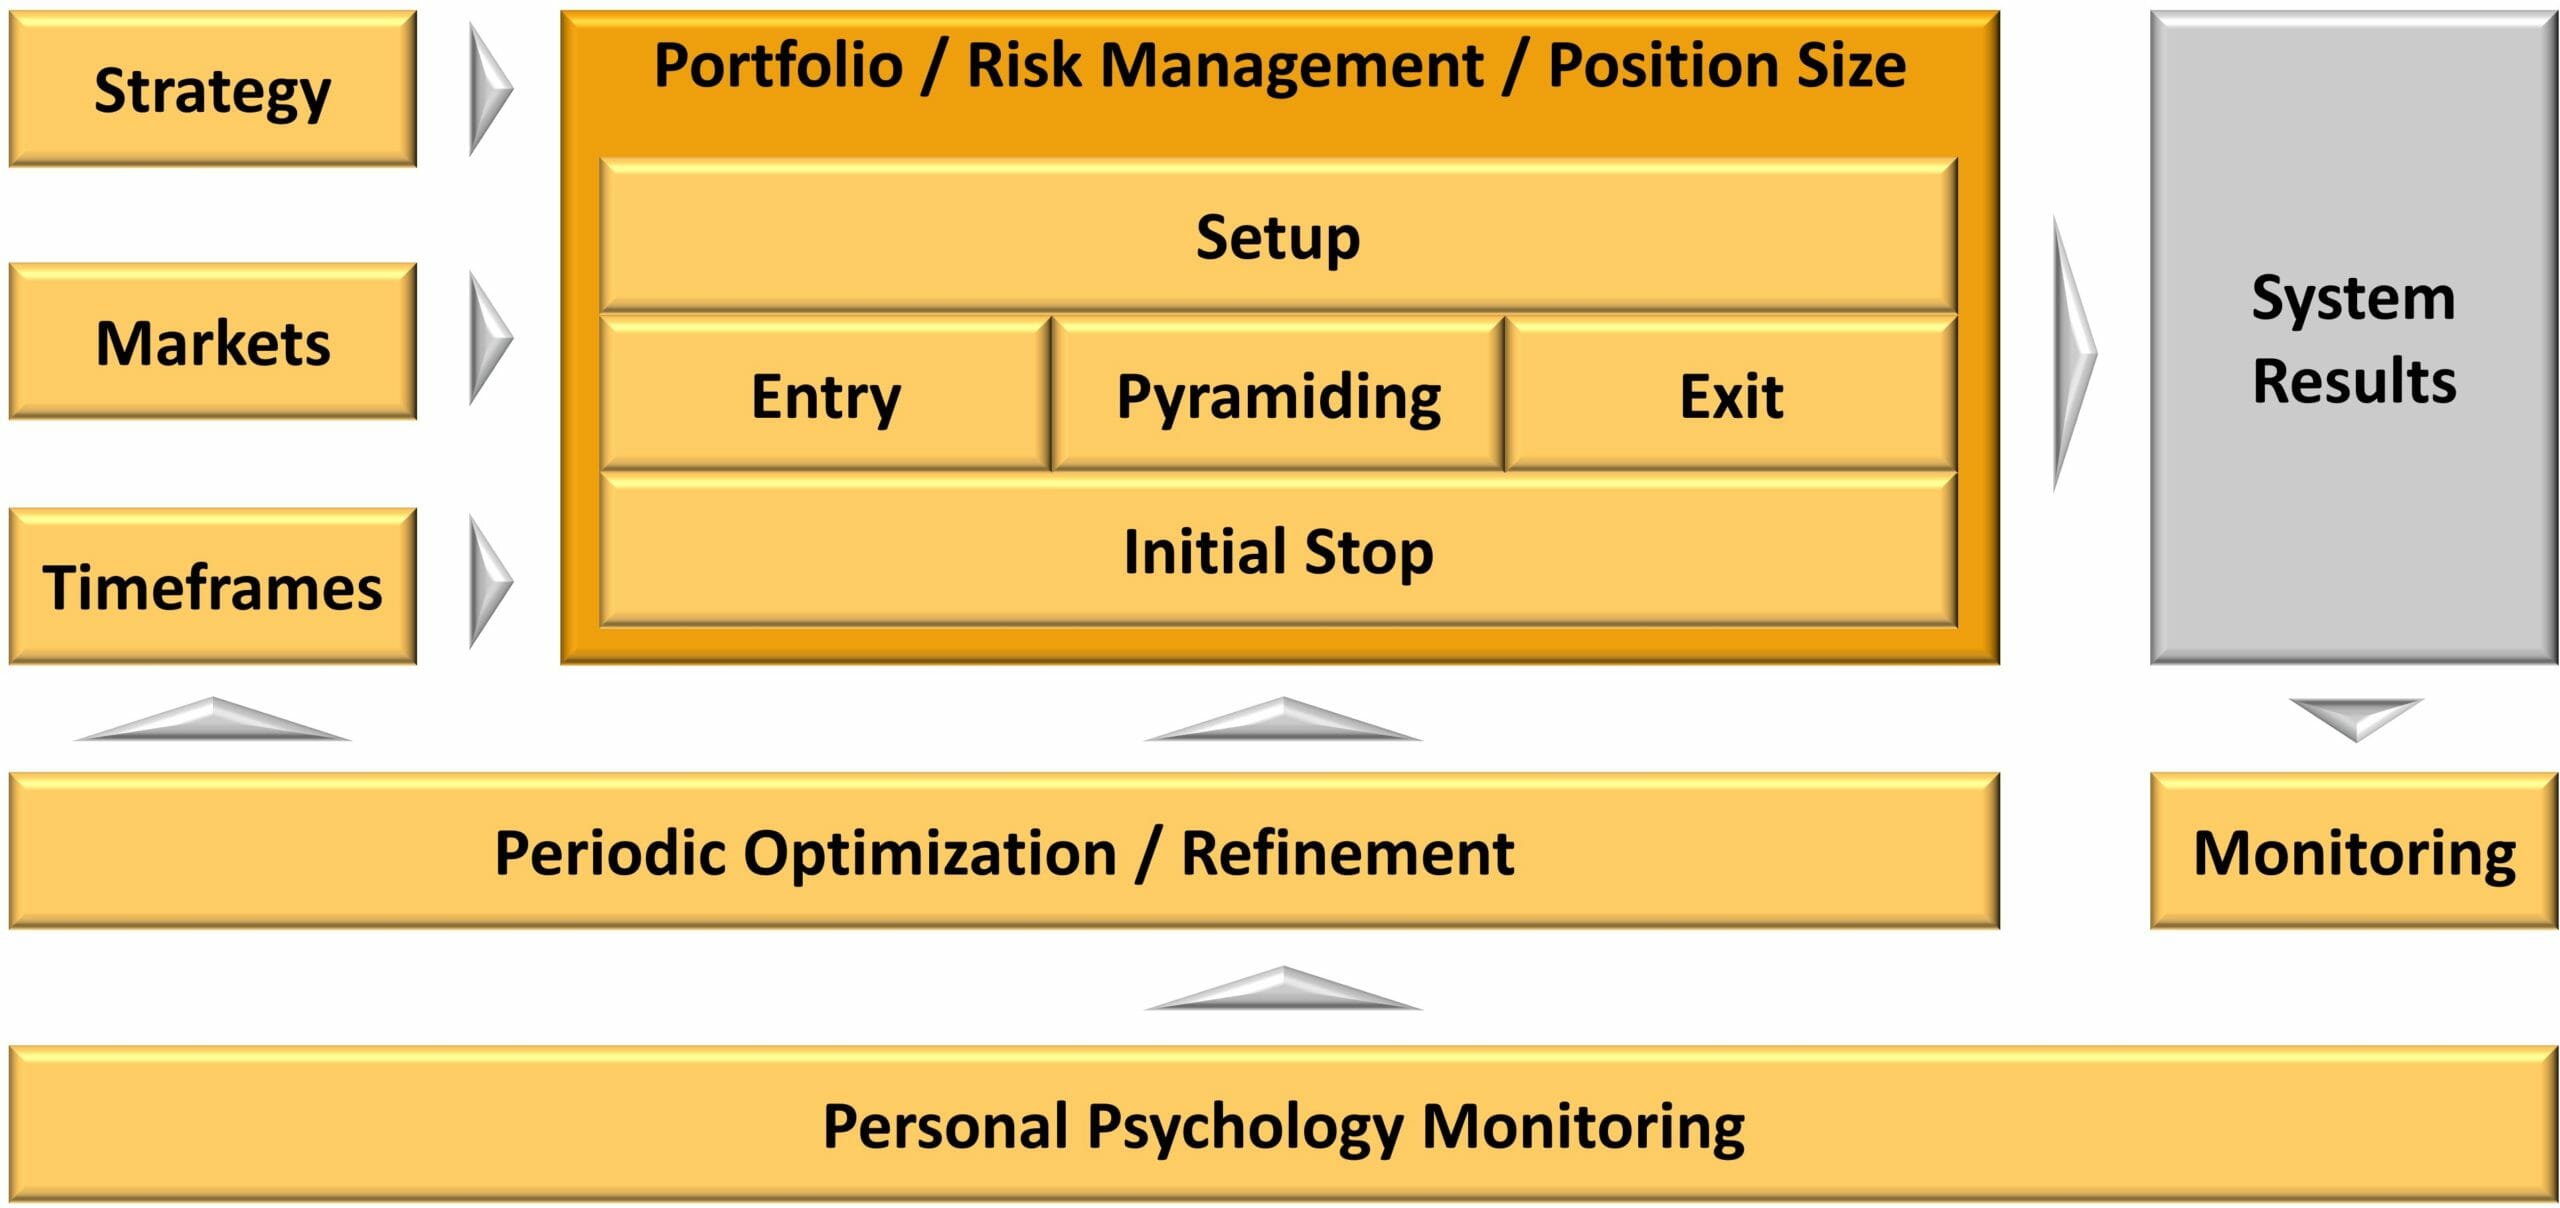
First, you have to understand what trading strategy you’re working on, what markets you’re trading, what timeframes, and what rules make up the system itself, which includes setup, entry, pyramiding, exit, and initial stop loss. Then wrapped around all of that is the portfolio or risk management and position sizing rules.
That system generates a particular set of results you will monitor continuously to ensure it performs as expected. Then, periodically, you will optimize and refine that system. Throughout this process, you will monitor your psychology around that system and ensure you have absolute confidence in it.
The whole framework, while broader than a mean reversion, is essential for systematic trading in general. Too many traders think about a certain trade or indicator, whereas if you have a whole framework to guide you in your trading, it’s a much more powerful way to think about things.
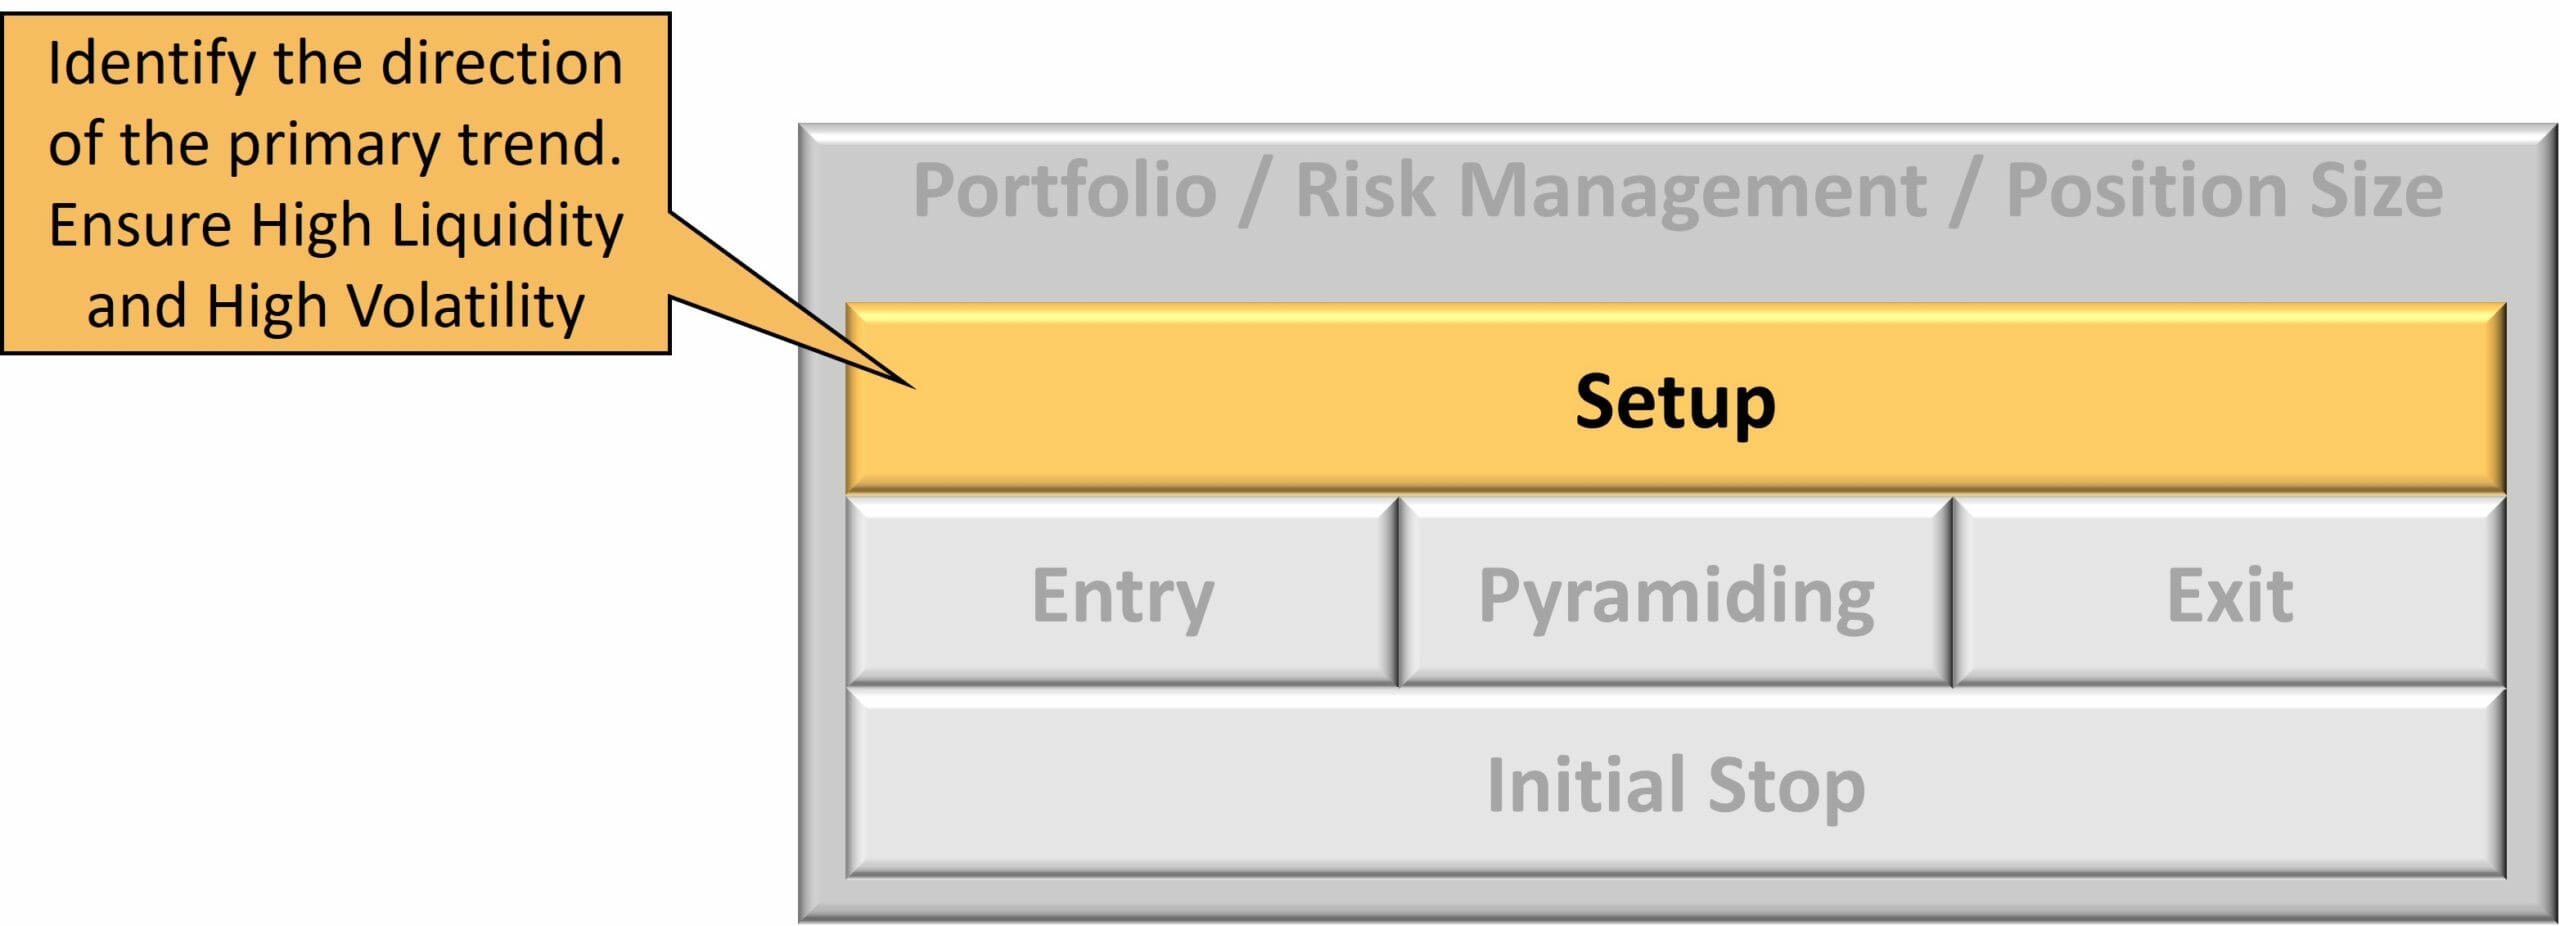
Let’s get into the components of a mean reversion strategy and discuss what each component requires to make a mean revision strategy work. In the diagram below, you’ve got the central part of my trading system framework: The system itself.
Description of The Components of a Mean Reversion Trading Strategy
To have a complete trading system you need the setup, entry, pyramiding, exit, and initial stop loss, and the portfolio management, risk management, and position sizing rules. For mean reversion, each of these requires a certain style or method of thinking to get the system right and ensure it’s profitable.
Mean Reversion Trading Setup
In the setup, you need to identify the direction of the primary trend. The primary trend is super important because if we trade in the direction of the primary trend, we tend to have a higher average profit per trade.
Mean reversion can work and be profitable trading against the primary trend, but the average profit portrayed tends to be much smaller. One of the challenges with mean reversion is that the average profit per trade in the mean reversion system is typically very low. Because it’s low, it makes it much more difficult to trade well and profitably because any amount of slippage and excess commissions or mistakes can ruin the strategy.
My approach is to trade in the direction of the primary trend with mean reversion because that gives you a bigger edge. If we go back to our elastic band analogy, if the trend is up and we are buying when it’s oversold, there’s a bigger snap back to the trend. However, if the trend is up and we’re short-selling, we’re counting on a stretch above the primary trend to snap back to the trend, which tends to be a smaller snapback because the trend is up. It goes above the trend, then it comes down, goes above the trend, and comes down, in which there are smaller moves. Thus, it’s much better off if we trade in the direction of the primary trend.

The second thing you need to do is ensure that your instruments are high liquidity. High liquidity is significant in mean reversion trading because the average profit per trade in mean reversion strategies is very low. If you’re trying to trade small-cap stocks with low liquidity, then the slippage you get from those stocks will kill the profitability of your mean reversion system.
So the setup for your mean reversion trading is:
- Identify the direction of the primary trend
- Make sure it’s a very highly liquid stock
- Look for high volatility instruments
The higher the volatility, the better because that means the amplitude of the moves around the primary trend will increase, giving you a greater chance for profitability. Thus, that’s the setup for mean reversion trading.
Mean Reversion Entry Signal
We’re looking for an extreme overbought or oversold condition in the entry for mean reversion trading, depending on which direction we’re trading in. We’re waiting for the price to move a long way against the trend to profit from the bounce-back towards the trend or in the direction of the trend. Typically, we will use an overbought, oversold oscillator or a certain number of down bars or up bars to tell us that the price has moved firmly in that direction.
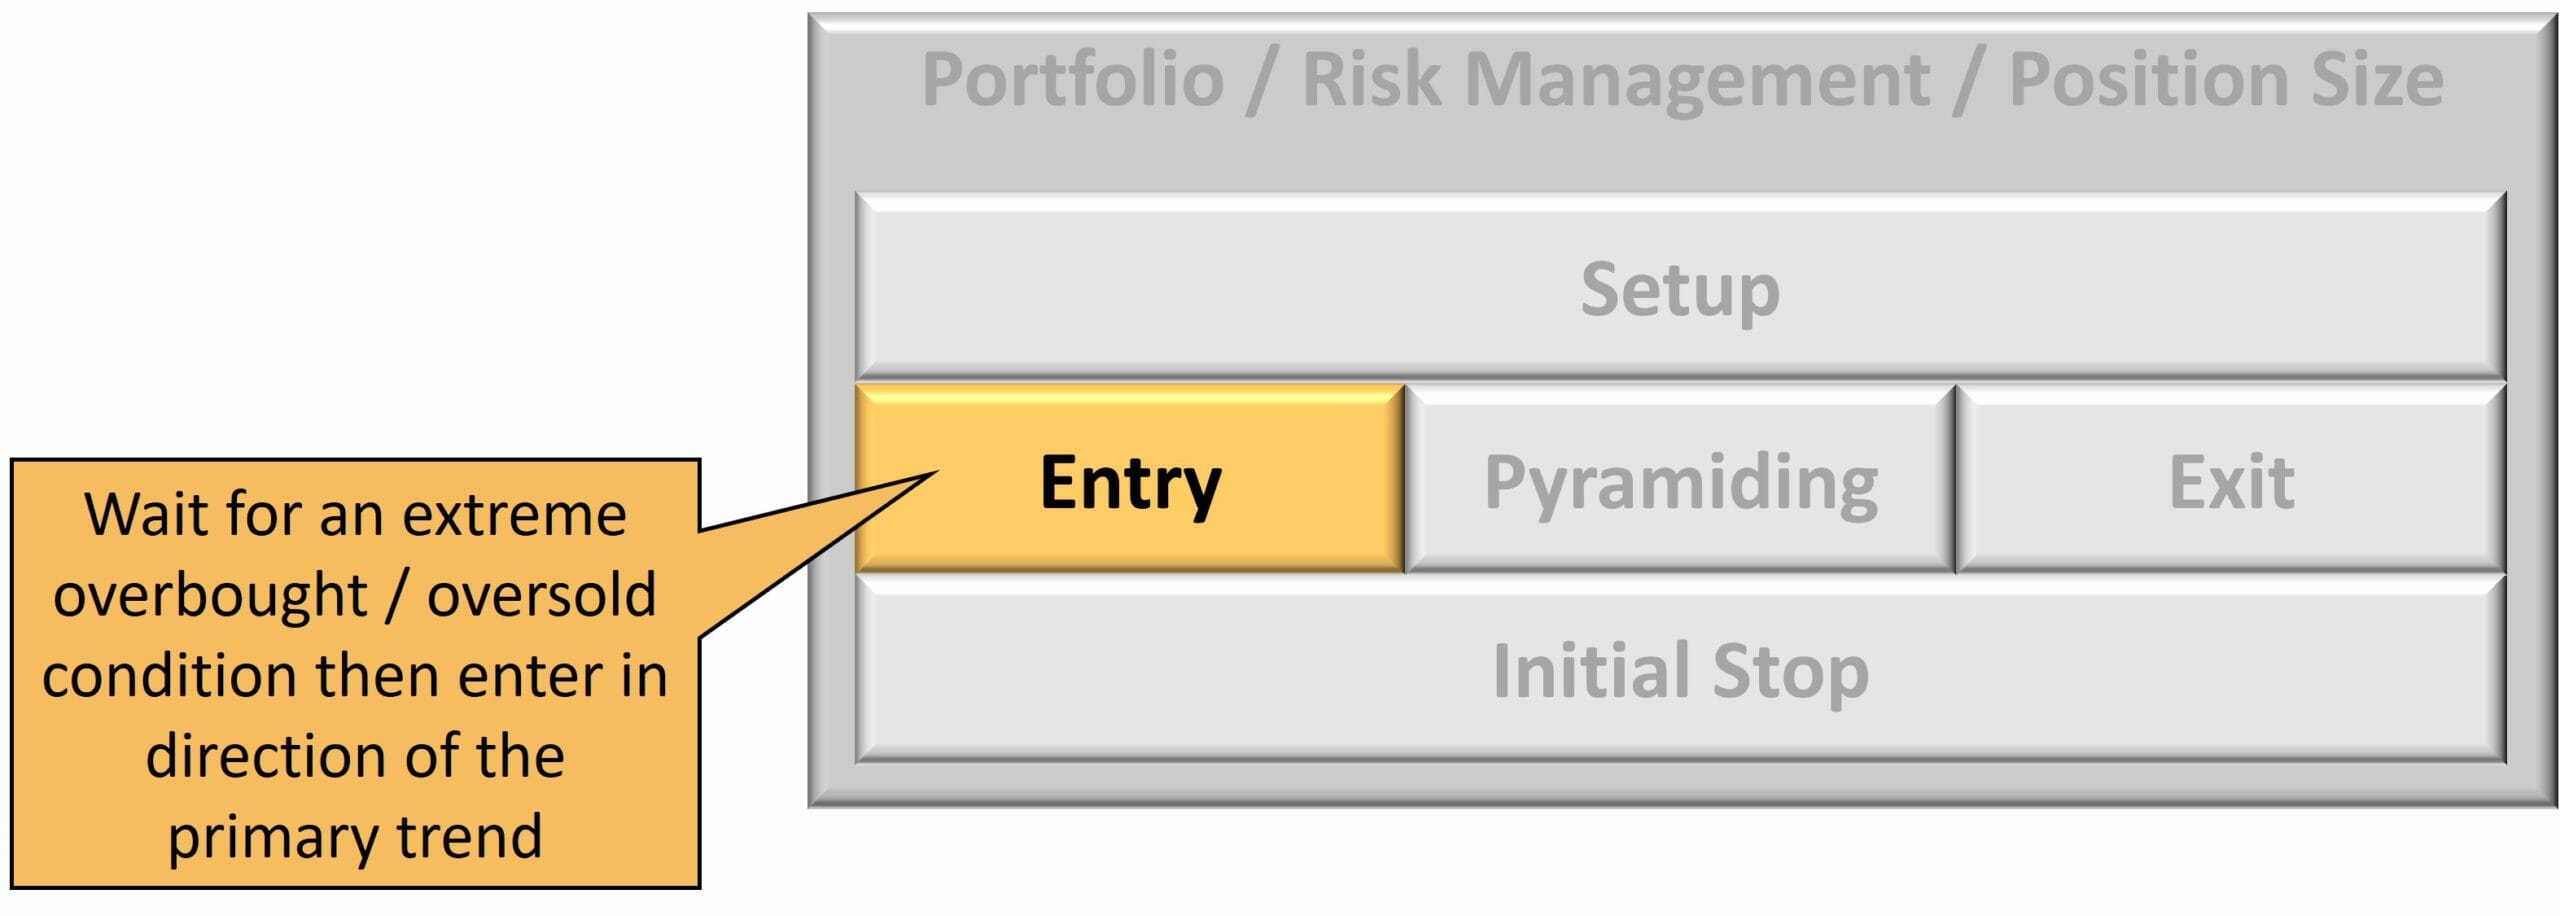
Once you’ve identified an overbought or oversold condition, the simplest approach is to enter the next bar at the open or today’s bar at the close, expecting a snap back.
Another more profitable way to do it is first to identify the oversold or overbought condition. Secondly, put a limit order in the market at a bigger stretch further away from the price. So if we’re going long, we’re looking for a bull market, we’re looking for an oversold condition, and then we put a limit order just a little further down so that the next day if this price stretches a little more, our limit order gets hit. Then that gives us that bigger snap back in the direction of the trend.

Typically, you’ll get a higher average profit if you enter on a limit order at a slightly bigger stretch than if you enter at the close or on the open of the next day. Entering with a limit order is a little more complicated to manage but is generally much more profitable.
Mean Reversion Stop Losses
You must consider protecting your capital once we’ve entered a mean reversion trade. Most people will say you should only trade a system with a stop loss; that’s probably true in most cases. The challenge for mean reversion trading is if you put a stop loss too close to your entry position, it does tend to break the system.
What happens is, let’s say we’re trading on the long side, we enter on a dip, and the price has some short-term momentum down; if we put a stop loss in too tightly, often that stop loss will get hit before the bounce back in the direction of the trend.
By adding a tight stop loss, we increase our losing trades and reduce our percentage of winning trades. Thus, it reduces the system’s accuracy, and the profitability or the expectancy of a mean reversion trading system comes from having a highly accurate or high win rate—lots of small wins and the occasional significant loss. However, if you put your stop loss too close, you get more substantial losses, and the system’s profitability breaks down. In your stop loss for a mean reversion system, you want to use a much wider stop because you’re trying to protect yourself against a real disaster where the stop dips and keeps dipping for a long time after that. If you have a wider stop like that, it will only get hit sometimes. However, it’ll only get hit in the direst of circumstances, so your system of profitability or high win rate remains intact, and the overall expectancy of the system remains positive.
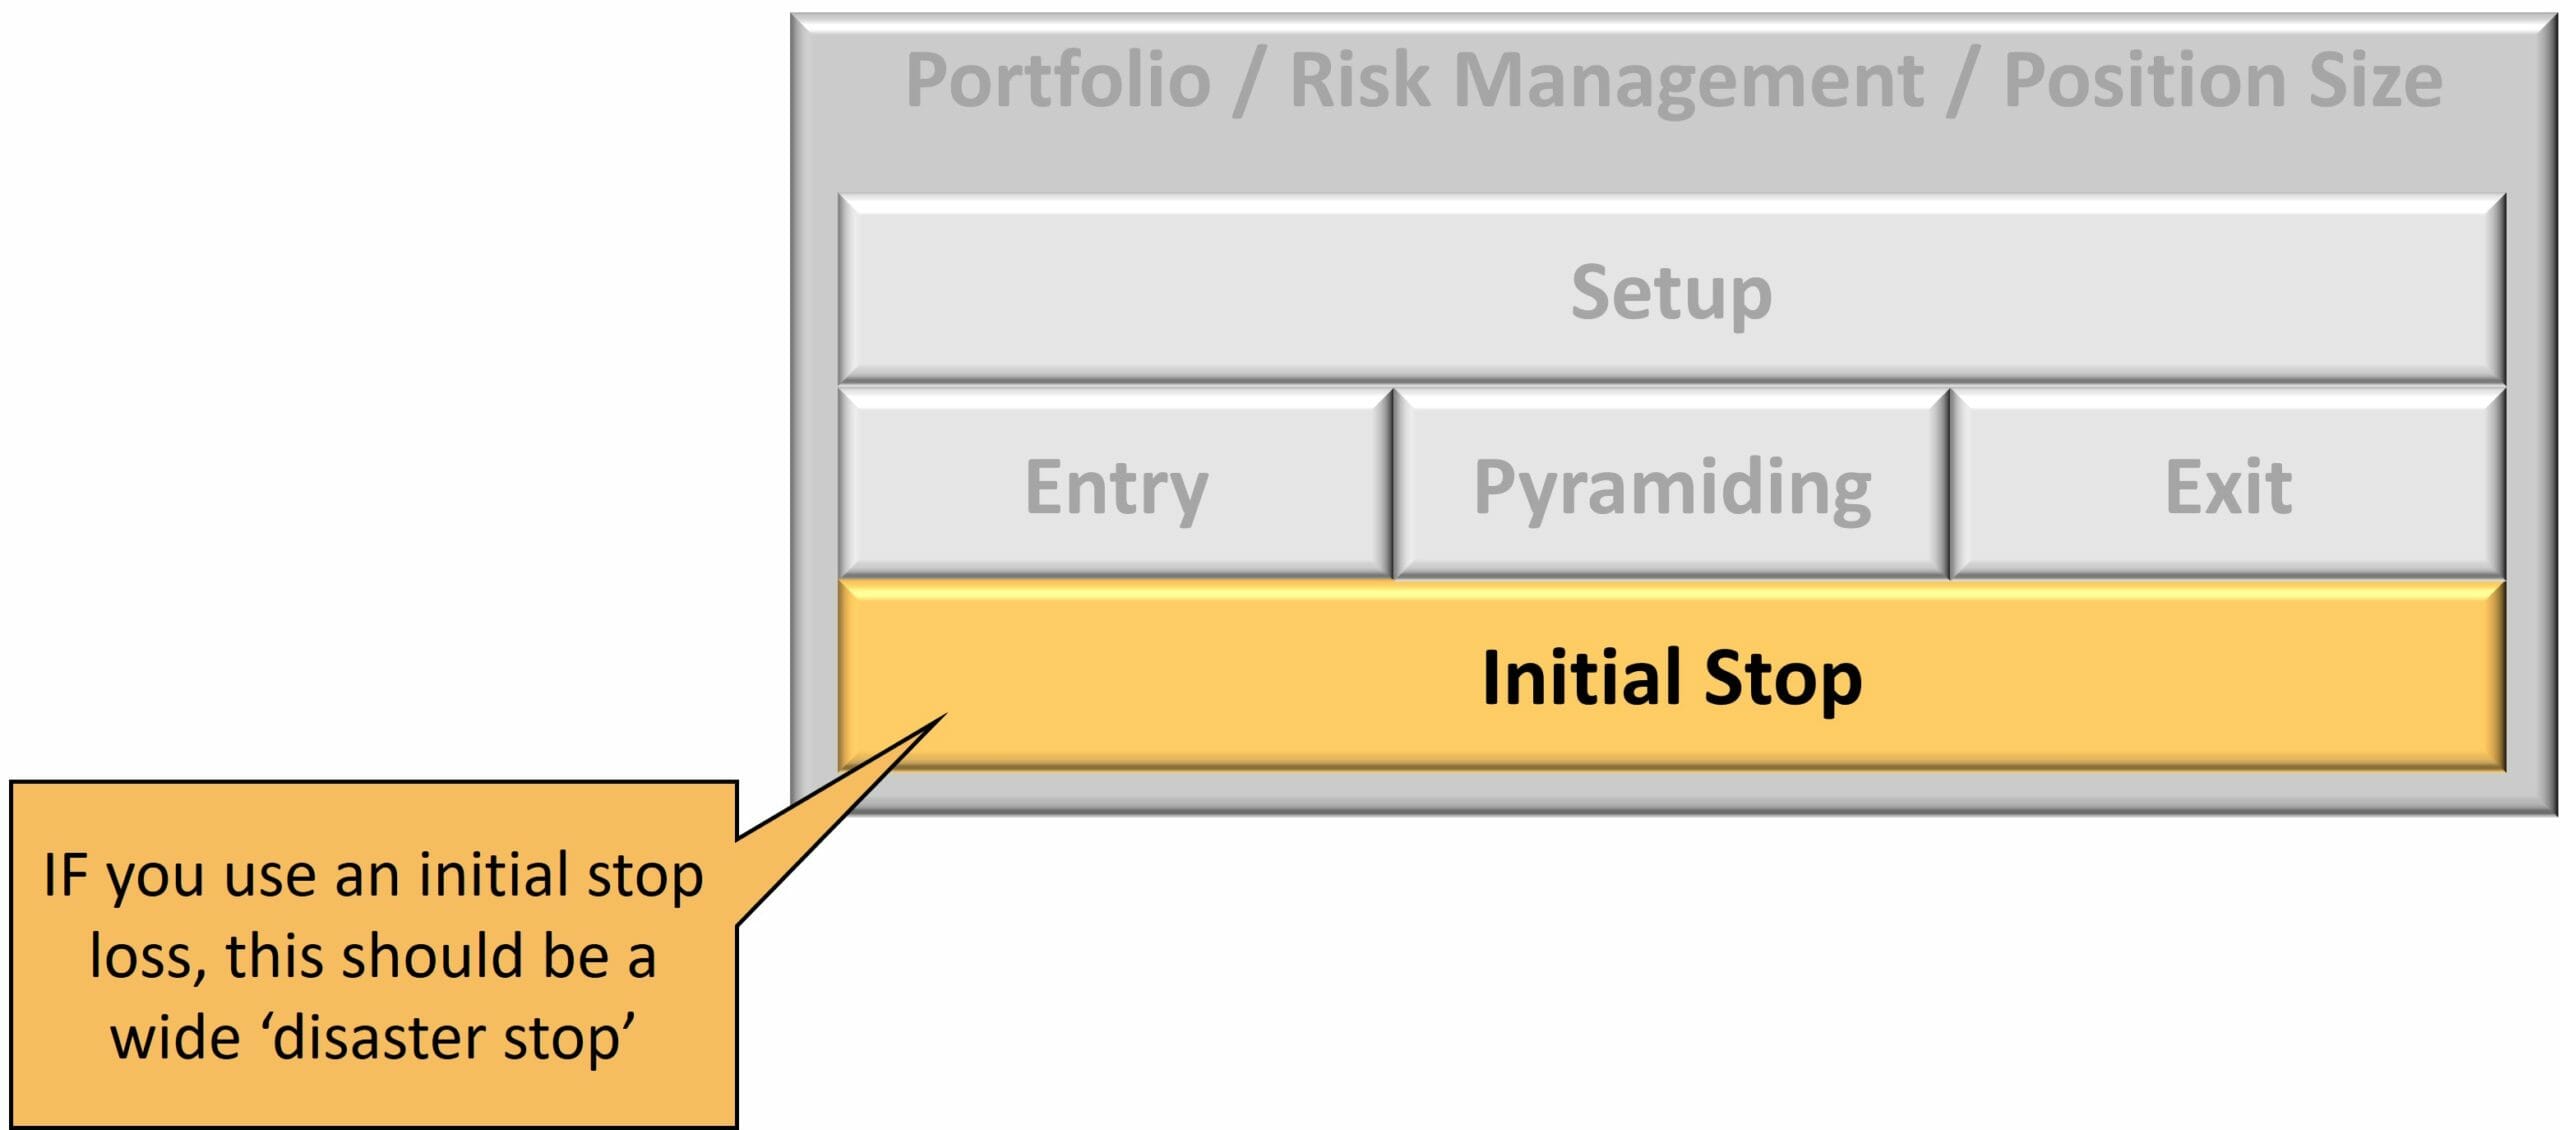
If you put a stop loss in your trading system or strategy, backtest it at different increasing widths and notice where the system performs best. You’ll see for mean reversion, it’s at vast stop loss levels. I’m talking about daily charts, 10-30% wide or even more, depending on the stock’s volatility. You want your stop loss to be positioned far from the price action, so you still benefit from the high win rate; that’s your initial stop loss.
Mean Reversion Pyramiding
I don’t use pyramiding in mean reversion trading systems, but some well-known mean reversion trading strategies exist where you do a pyramid into the position. Pyramiding in mean reversion strategies means adding to your position as it moves against you.
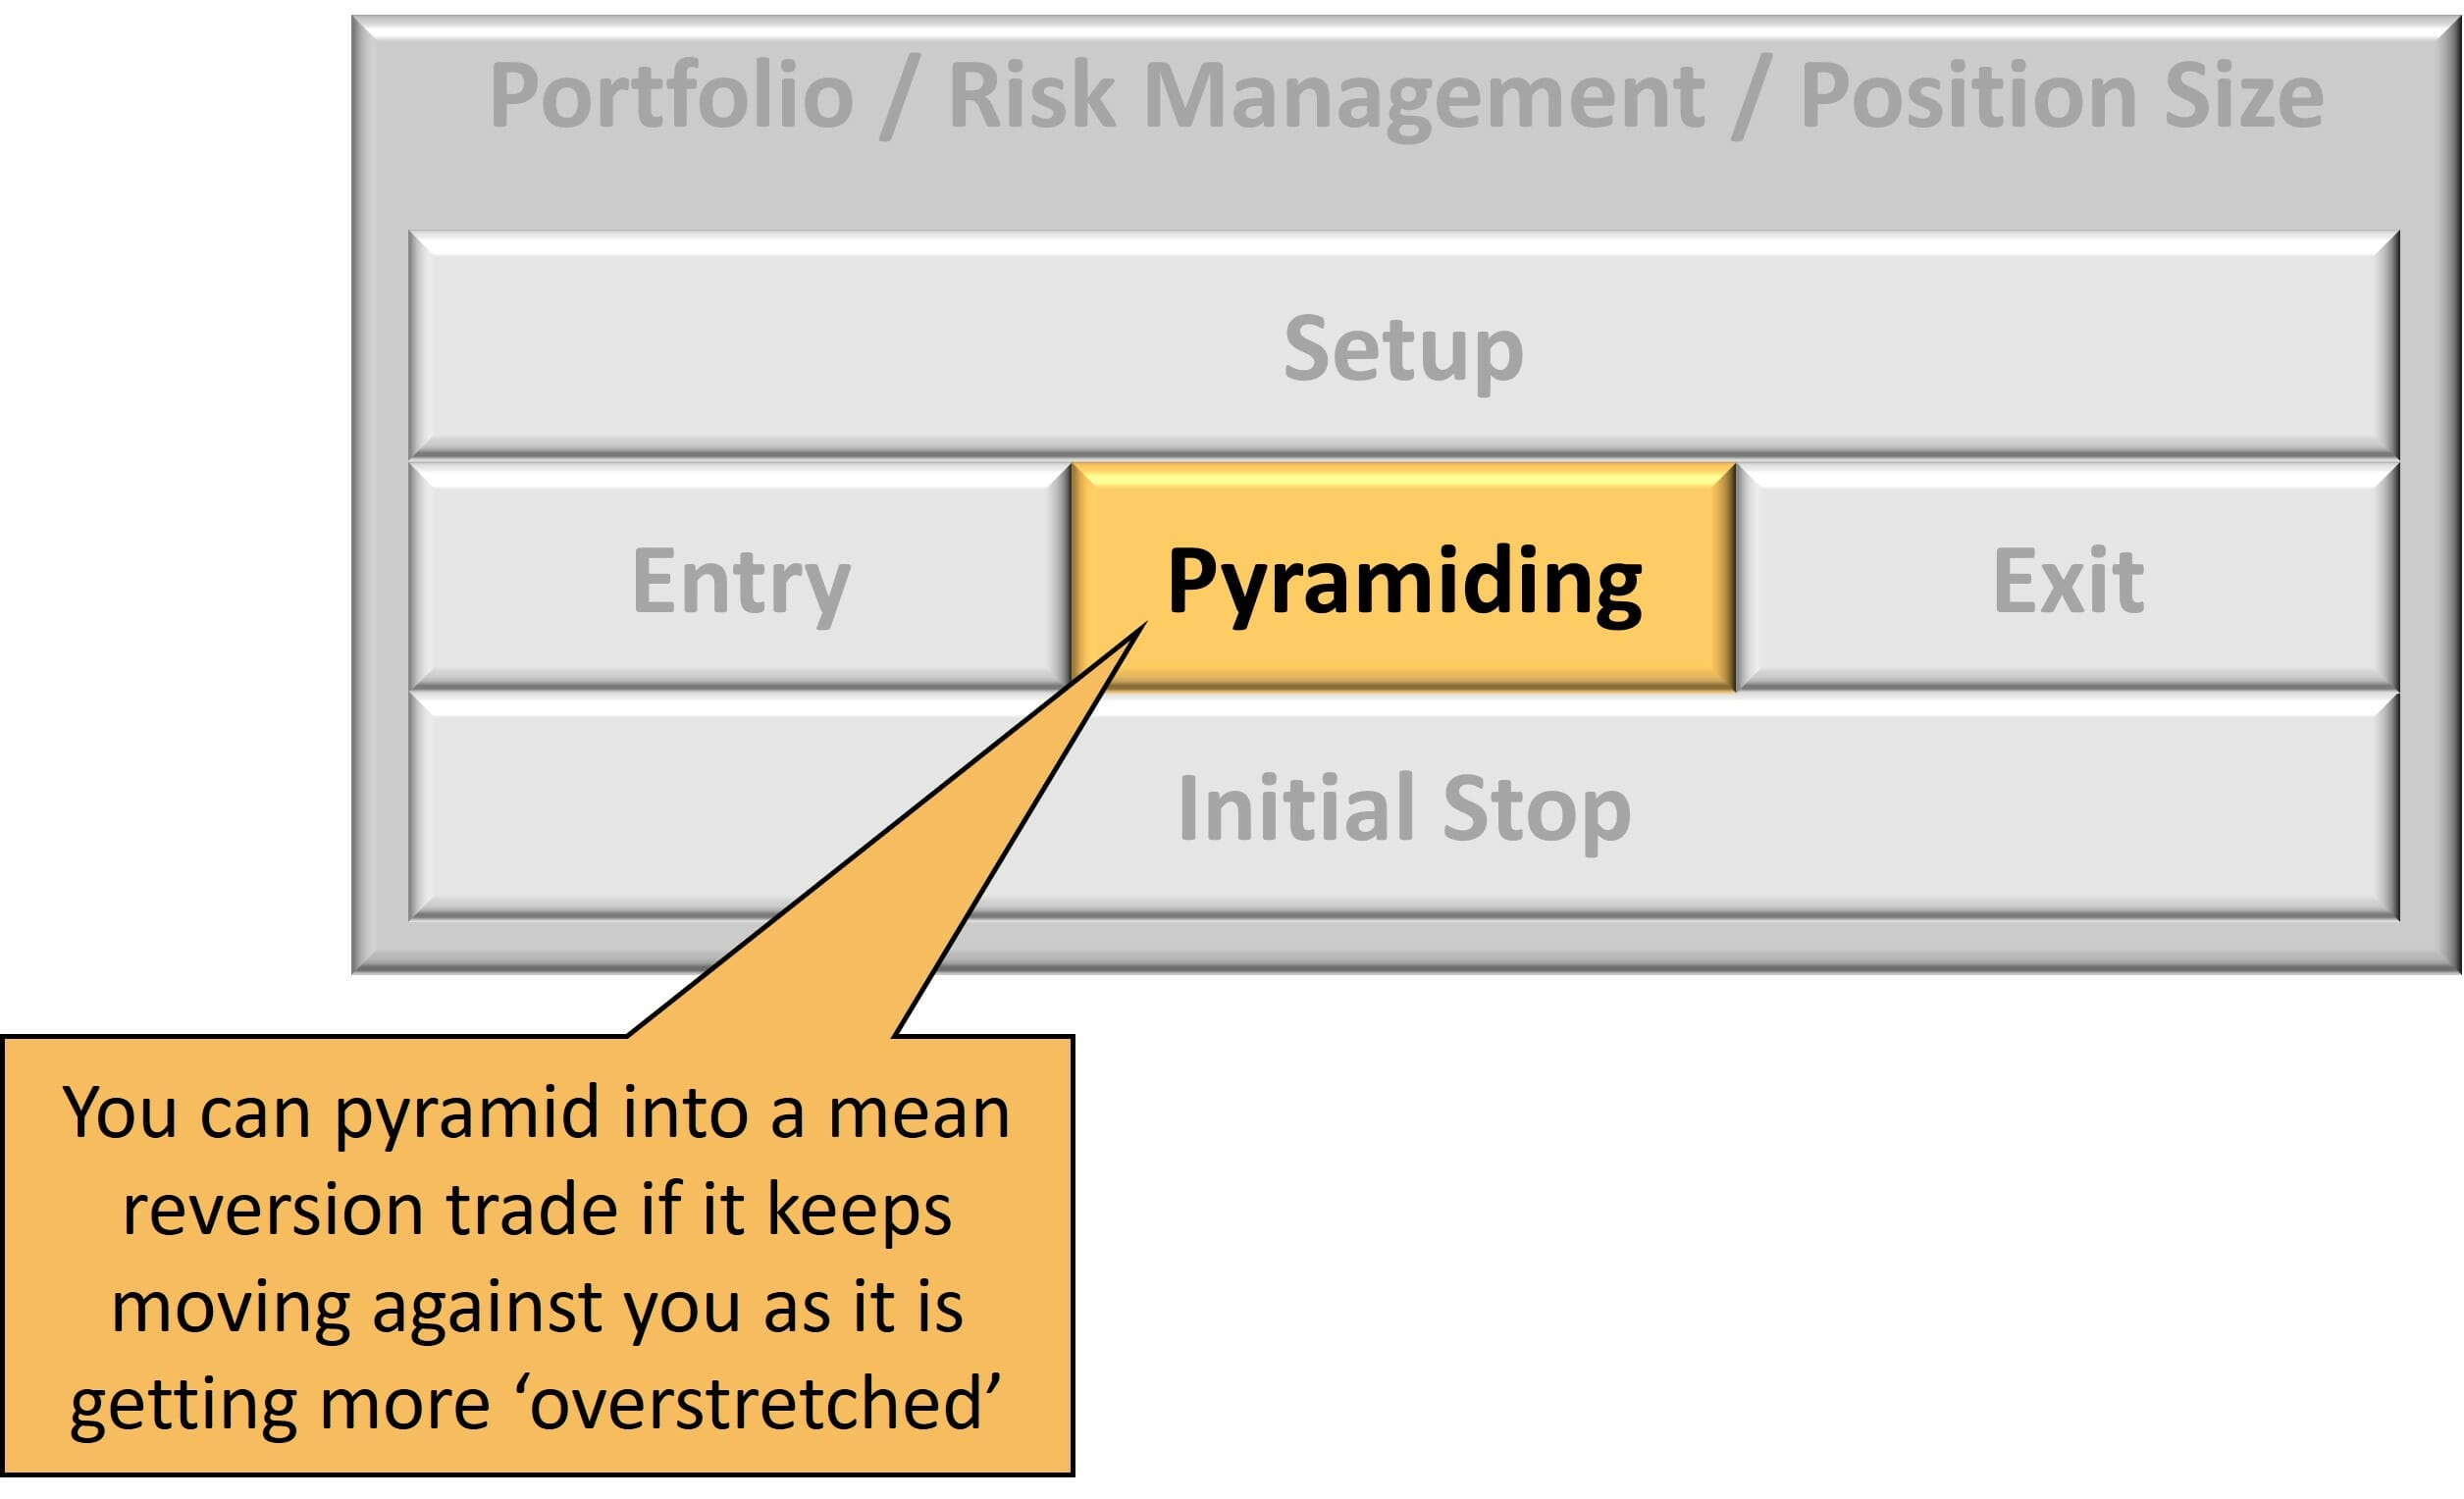
Let’s say we identify an oversold condition, the market’s gone down, and we buy a portion of our position, hoping for a bounce back. But then it moves further against us, stretching that elastic band further. As it moves against us, we buy another bit of your position. Then if it keeps moving against us, buy another bit of your position.
What we’re doing there is loading up on the trade as the elastic band gets more and more stretched, so when it snaps back, we’ve got more profit. I don’t do this since I go in once on each strategy because I would diversify between multiple strategies instead of having more entries in one trade. However, it’s a legitimate approach, but it’s not one I use.
Mean Reversion Exit Signals
The next component of a mean reversion trading strategy is the exit. This is very different from the typical trend following a momentum buy-and-hold mentality. What we’re doing with a mean reversion trading strategy is exiting after a minimal move in our favour; we want to profit from the bounce. We’re not waiting for the whole trend but the entire move. If you wish to profit from the big trend, use a trend-following strategy. For mean reversion, when it’s oversold, and we buy when we get a little bounce up, we want to get out and take our profits because that’s how we get the high win rate.

If it’s a short strategy, the market is trending going down long term but rallies to an overbought in the short term, then we short sell the stock and cover the short when it collapses just a little bit. On the short side, we are not looking for the whole collapse to zero – we are just looking for a small move in our direction.
Similarly on the long side, if the stock is trending up and has a sharp correction down to an oversold level then we buy. We would hold this position until a small bounce in our favour.
What does that look like in terms of specific indicators and rules? Here are some examples:
- Exit after the first close in the direction of your trade
- Exit after two consecutive closes in the direction of your trade
- Exit if the RSI bounces above a certain level such as RSI(2) crossing above 40
- Exit if the price rallies to the highest level in the last 3 days
Mean reversion exits are quick, nimble, and keep you in the trade for a very short period of time. Typically, the average trade duration of my mean reversion strategies on daily charts is one to three days, depending on the system.
Mean Reversion Portfolio Risk Management & Position Sizing
Next, we have the portfolio risk management and position sizing rules. The most significant thing to stress is that you want to keep your position small. In my mean reversion trading systems, what I do is spread my capital over a large number of trades (say 10-20 trades per system). The reason is mean reversion gives us a lot of winners, but the occasional loss tends to be large, and I don’t want to have a large position with a large loss hurt my account.

Therefore you must keep the positions reasonably small and make sure that you remember the size of the biggest loss. Then, when you run your backtest and look at the range of trading outcomes, look at how significant the biggest loss is and make sure that with your position size, you are comfortable that that loss won’t wipe you out or won’t hurt you, or push you past your drawdown tolerance.
That’s the key to ensuring that you stay profitable, and your equity curve is nice and smooth and isn’t punctuated by massive declines that are hard to recover from.
Advantages & Disadvantages of Mean Reversion Trading
It is important to understand the advantages and disadvantages of mean reversion trading strategies because every trading strategy has different trade-offs. If you are going to trade mean reversion effectively, you need to understand this and ensure that it is a strategy you can follow, both psychologically and practically.
So what are the advantages and disadvantages of mean reversion trading strategies?
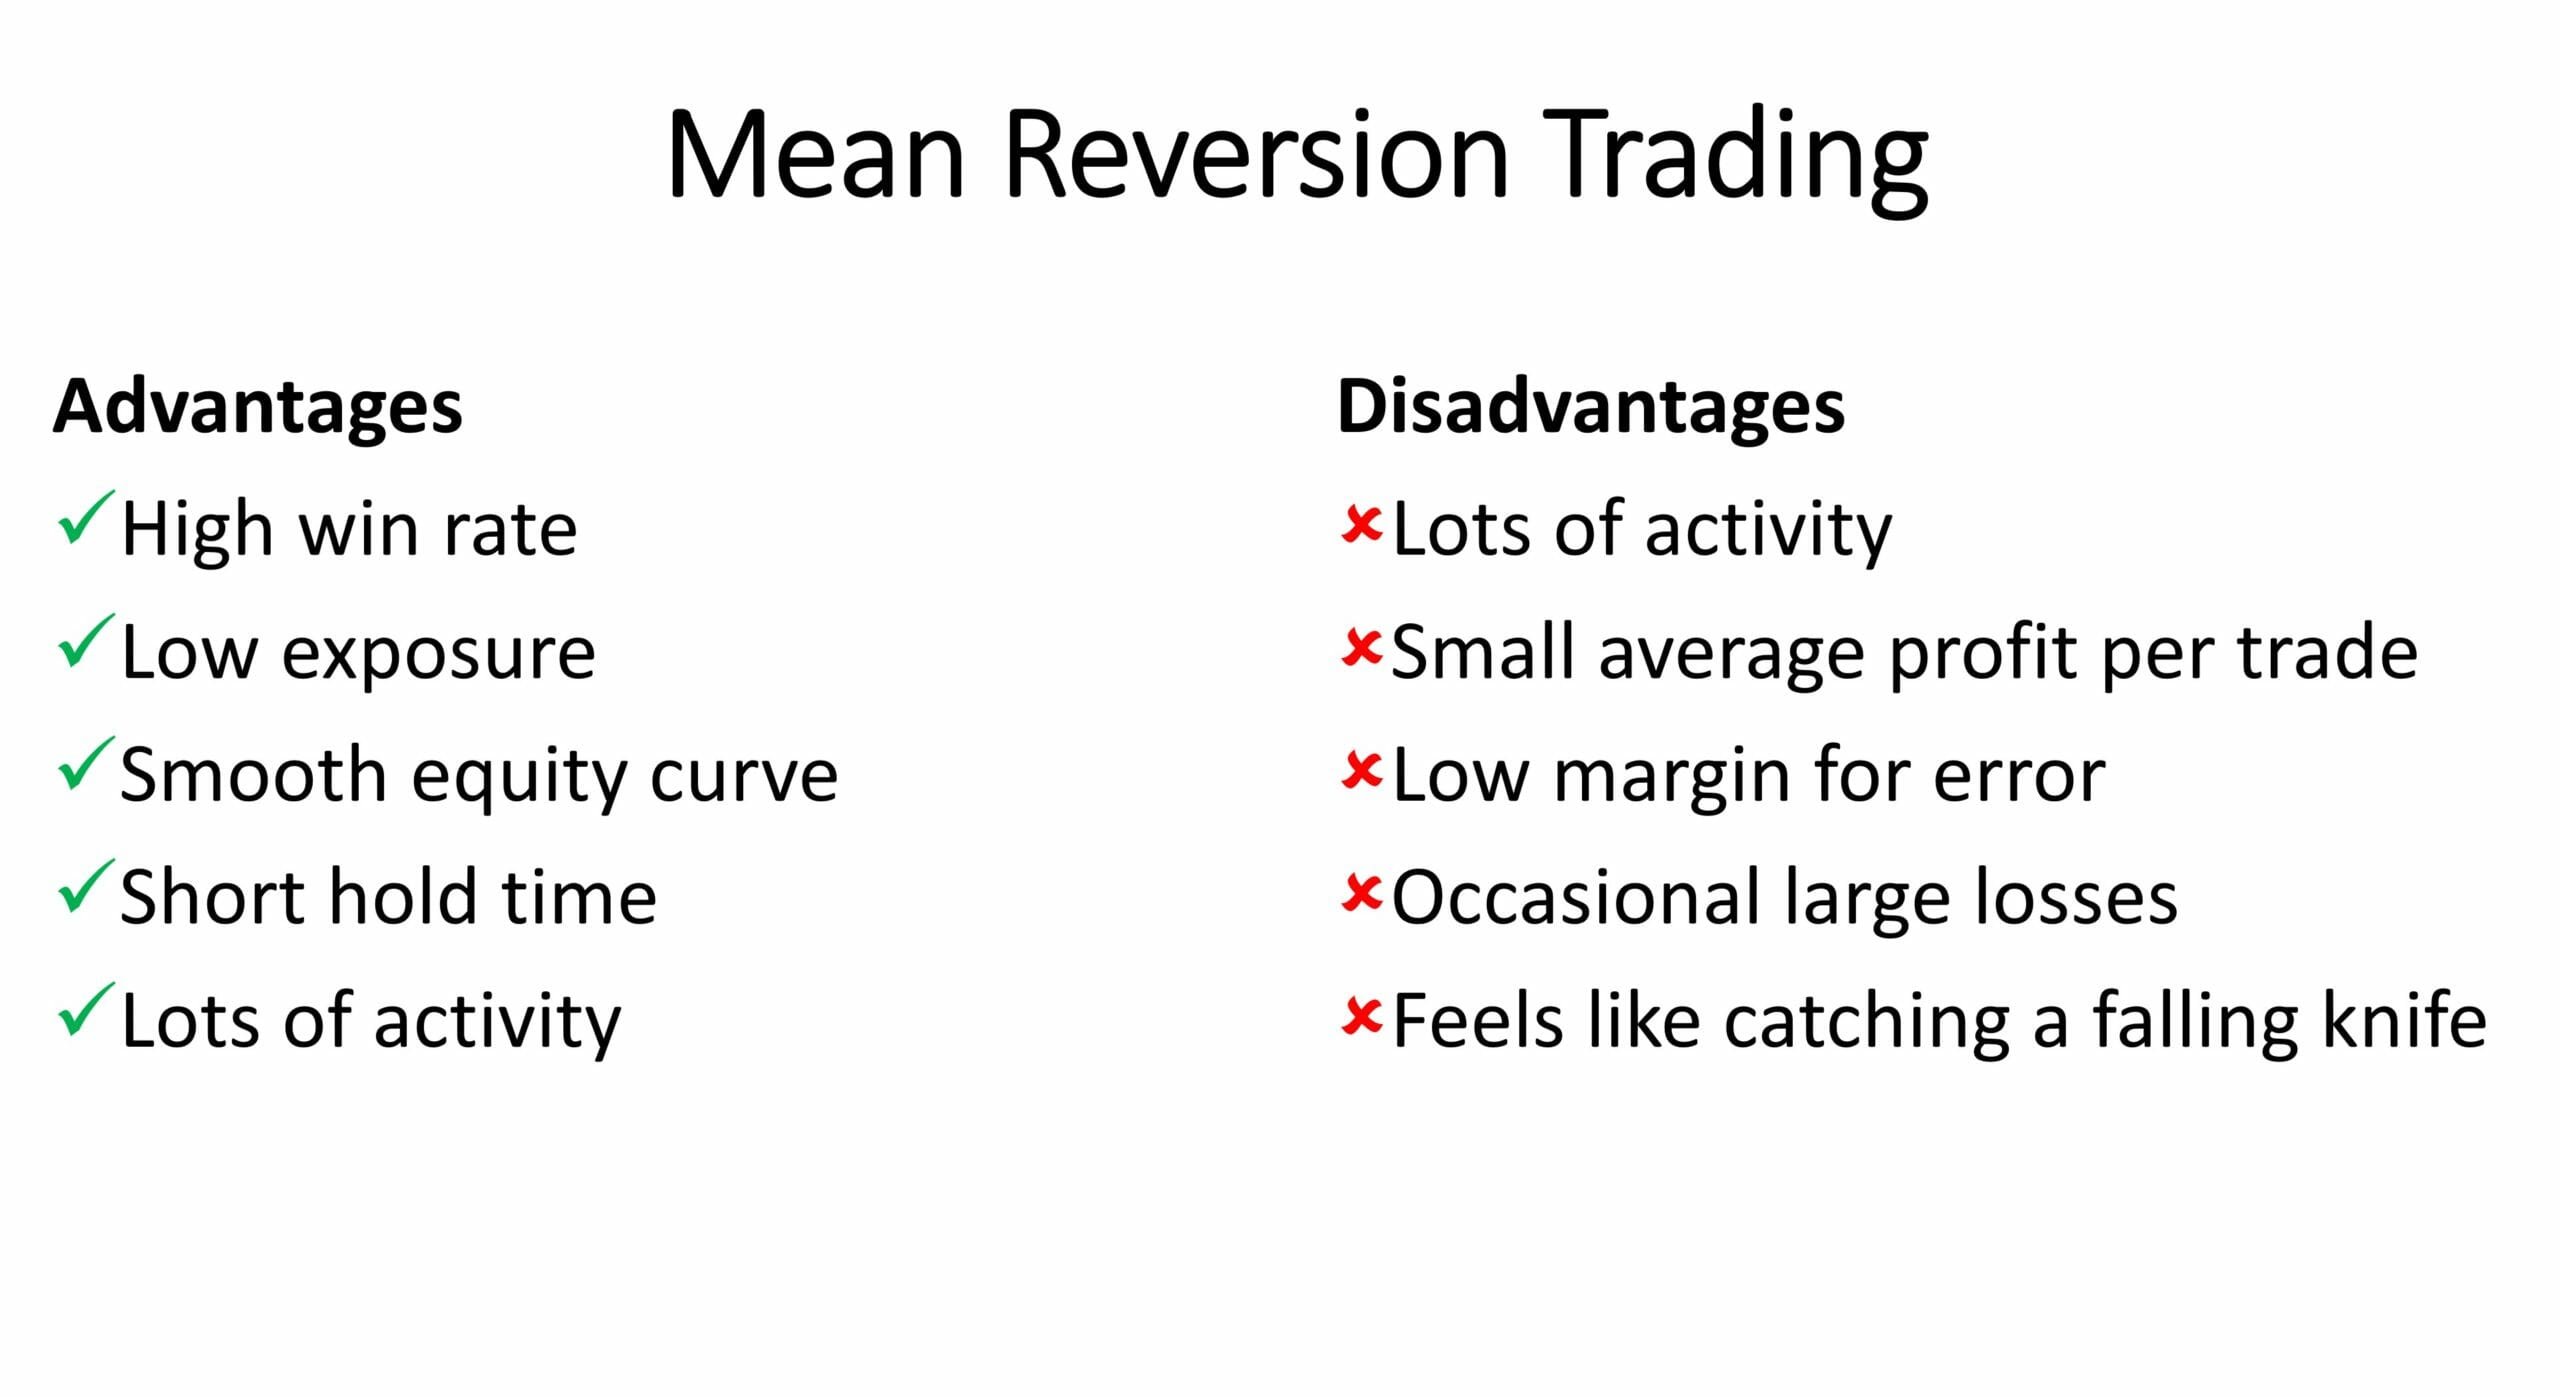
Advantages Of Mean Reversion Trading Strategies
1. Mean Reversion Trading Strategies Have High Win Rate
The first advantage of mean reversion trading is the high win rate you typically get. This is important if you like a lot of positive feedback in your trading. One of the general challenges about trading in general is that we get a lot of negative feedback, which can be difficult, so having strategies like this gives a huge boost to your trading psychology.
So one of the best things about mean reversion trading is that it’s a high win rate strategy, which means you can be right 70-90% of the time – this is great for your trading ego, and it may help to calm your emotions from running your hugely profitable 30% win rate trend trading system. With mean reversion you constantly get positive feedback on your trading, it doesn’t mean it makes astronomical returns just because you’re right 80% of the time, but it does give you that positive feedback that is missing from some other trading strategies.
2. Mean Reversion Trading Strategies Often Have Low Exposure
Low exposure is powerful because you can generate profits with mean reversion without having a lot of your money tied up in the market all the time. For example, I have a mean reversion strategy which only has an average exposure rate of about 5%. Which means your money is invested 5% of the time on average. This helps lower catastrophic risk because you are in the market so little.
If you can make decent returns with a low average exposure, that means you’ve got a lower exposure to catastrophic market moves, changes in market trends, and sudden shocks to the market because your system isn’t in the market all the time.
3. Mean Reversion Trading Strategies Often Have Smooth Equity Curves
This is directly related to the high win rate of the systems. Mean reversion systems tends to have smooth equity curves because the high win rate allows the equity curve to edge up consistently over time. These gains can be punctuated by the occasional significant loss before the smooth moves up continue because the worst case loss is usually substantially larger than the average win. If you stand back and look at the equity curve, it is a nice, smooth line compared to trend following, which can be a bit more of a wild ride. Smooth equity curves are an excellent advantage of mean reversion trading.
4. Mean Reversion Trading Strategies Have Short Hold Time
Mean reversion is excellent for people who like a bit of action, want to hold on for a short time, and want to confirm whether the trade was a winner or a loser quickly. The average duration for a mean revision system on a daily chart is typically one to five days.
Hold times for these systems are generally not much more than that because the move that we are trying to catch is a short, sharp bounce after a sudden move against the trend and those happen quickly. We want to hold on until the bounce occurs and then and exit fast before our mean reversion profits disappear.
5. Mean Reversion Trading Strategies Have Lots of Activity
Because the hold time of mean reversion trading systems is so short, these systems can give us a lot of activity as you will be entering and exiting trades all of the time. This is great, particularly if you’re an action-seeking person. If you like a lot of activity and trades to keep you interested, reversion trading is a powerful way to make money in the markets.
Disadvantages Of Mean Reversion Trading Strategies
1. Mean Reversion Trading Strategies Have Lots of Activity
I’ve got this in the advantages and the disadvantages column because one of the things that you’ve got to do in your trading is find strategies that fit your personality, objectives, and lifestyle.
I’m a fairly laid-back and considered person, I want a manageable amount of activity, and take only a few trades every day. When I was trading manually, the activity level was a real disadvantage for mean reversion for me. I naturally preferred long hold times, buy now, and sell several months after capturing a major trend.
Now that my trading is automated, it only matters a little. As a result it is no longer a disadvantage from my perspective, but it can be for you if you’re trading manually. You’ve got to make sure that you match the activity level with your natural inclination and that you can fit in with your lifestyle.
2. Mean Reversion Trading Strategies Have Small Average Profit Per Trade
The average profit per trade is across all trades in your backtest, is the percentage difference between the entry and exit prices of your trades. In mean reversion, you’ll have many small wins in the occasional significant loss. On average, it will be profitable, assuming you’ve designed your system well, but the average profit per trade is typically very low.
The average profit per trade for mean reversion is small, and that’s okay as long as you’ve got highly liquid instruments and are very careful with your execution. However, you’ve got to be cautious because if you’re paying too much in commission or getting too much slippage on your orders, or late in your trade execution, it can erode the system’s profitability. The small average profit per trade means in mean reversion trading you must have excellent attention to detail and precision. Otherwise, it can end up hurting you.
I guess closely related to the small average profit per trade is that low margin for error when it comes to trading mistakes, contrast that with trend following. With trend following, when you’ve got a 20, 30, 40, or 50% average profit per trade because you’ve got some monster winners, it’s got a very high margin for error. If you make occasional trading mistakes with trend trading, it will generally be okay (unless of course you miss the biggest winning trade of the year – ouch).
However, with mean reversion, the average profit per trade is small. If you make a small recurring mistake, or a single large mistake, it can really hurt the system. A common mistake is if you held onto a losing trade that kept moving against you, and you should have gotten out of it, that could be a much more significant loss than you expected. That could wipe out the profits of the mean reversion strategy. You must ensure that you execute it faithfully, exactly as designed. Otherwise, you can end up in a world of hurt.
3. Mean Reversion Trading Strategies Have Occasional Significant Losses
With mean reversion, the profile is small wins and the occasional considerable loss. Having lots of small wins sounds good – after all you get to be right 70-80% of the time with this approach. This also looks great on paper in backtesting when you design the system. However, if the reality of that large loss will be psychologically challenging for you, then that can be a real problem.
Personally I don’t particularly enjoy wondering whether this trade will be a five or seven R-Multiple loss move against me. That risk-return profile is not natural to me, since I’m more of a trend follower. I like to risk small amounts and have many small losses in exchange for the occasional huge win.
So you’ve got to be aware that in mean reversion you will get the occasional large loss. They do come suddenly, and you’ve got to make sure you manage your exits carefully to keep that significant loss contained. Follow your rules strictly. Otherwise, that large loss will get out of hand and wipe out the system and your account.
4. Mean Reversion Trading Strategies Feel Like Catching A Falling Knife
If you hold a knife with the blade pointing down and drop it, and you try and catch it with the other hand, that’s quite dangerous. Because if the knife keeps falling, it can slice you and cut you on the way through.
It’s precisely what mean reversion can be like – we are trying to buy on a dip and hope that it bounces. If the stock keeps dipping, then that can be dangerous (this is where the occasional large losses come from – that’s why conservative position sizing is so important for mean reversion trading.
The psychological impact is also challenging because we are typically buying on a decline at the point of maximum fear. If that fear follows through and keeps magnifying, you will end up with a loss that could hurt, which is psychologically difficult… if the entry signal is at the point of maximum fear then we will buy very close to the bottom of the dip and quickly benefit from the rebound as the fear subsides.
Mean Reversion Trading Mistakes
There are 6 mean reversion trading mistakes that are absolute killers with the potential to destroy your trading system’s profitability and your account if you are not careful. Let’s cover them each in turn…
Mean Reversion Mistake 1: Trading Illiquid Instruments
One of the biggest problems with mean reversion trading is that the average profit portrayed could be bigger. What that means is if you get too much slippage, it’ll destroy the profitability of your strategy. So how do you avoid getting too much slippage? You ensure you trade highly illiquid stocks and ETFs with your mean reversion trading strategy. If you try and trade small caps and penny stocks in a mean reversion fashion, you’re getting hurt because the slippage will be too much and probably erode the average profit portrayed in your strategy.
The only exception to this is if you enter and exit your mean reversion trading strategy using limit orders. If you do that, you can use slightly lower liquidity levels in your trading, but you still have to be careful because you have to make sure you don’t let your slippage get out of hand.
Mean Reversion Mistake 2: Exiting Too Slowly
In mean reversion, we’re trying to capitalize on the elastic band we’re going to buy when it’s oversold, stretched, and then we are selling when it snaps back. Notice that snapback occurs quickly, and often after the snapback, there can be another collapse in price. You must make sure your mean reversion trading strategy is elegant.
When you are in a mean reversion trade, you are hoping for a quick price move in your favour. Good exits to consider include:
- exits after one close in your favour
- exit after two profitable closes in your favour
- exit if the RSI 2 pops up to a value of 30 or 40 (for a long side trade)
- exit if the stock closes above a 3-5 bar moving average
- exit if the stock makes a new 3 day high
These are all quick nimble exits because that’ll get you out with a good profit and quickly get you out of harm’s way. This is important because with mean reversion after the bounce, there can often be another collapse which can quickly turn a winning trade into a large loss. This happens because sometimes that initial oversold move is actually the start of a new downtrend. So the second big mistake in mean reversion is not exiting quickly enough. If you don’t get out quickly, you could get whacked by that downtrend when it resumes after a small bounce.
Mean Reversion Mistake 3: Using Tight Stop Losses
Tight stop losses are a real problem with mean reversion trading because mean reversion relies on a high win rate in order to give you a positive expectancy. You get lots of small wins and the occasional significant loss – for example you might have nine 1R gains and one 5R or 6R loss. In this typical mean reversion trade profile the the gains are much smaller than losses.
If you use a tight stop loss, what happens is many of those small gains will turn into losses because they often move against you before they bounce. If you’ve got a tight stop loss, the stop loss is going to take you out when your trade moves against you and lock in that loss. This also means you will miss the bounce, which will probably happen a day or two later.
Use wider stop losses in mean reversion to avoid your win rate dropping and your expectancy falling apart.
If you want to get around this, I suggest you use much wider stop losses or no stop loss (but be careful here and make sure your mean reversion trading system will get you out of a losing trade and won’t just let the loss keep getting bigger and bigger). A wide stop loss like 20-40% on a fairly volatile stock will protect your worst case scenario without locking in too many additional losses which destroy the expectancy of the trading system.
Mean Reversion Mistake 4: Hold and Hope
Most traders don’t like to have significant losses, and when you’re faced with a mean reversion trade that’s going against you, the natural inclination is just to hold on and hope that it turns around and bounces back in your favour. The problem with this is that if it doesn’t bounce back, you will end up with a massive loss as well as having your capital tied up for a long time waiting for a recovery.
Traders shouldn’t hold onto losing trades hoping for a recovery in mean reversion because the losses can be huge and there is no guarantee of a recovery to your entry level – you could be left holding for years and nothing but a massive loss to show for it!
With mean reversion, all of those little gains will not add up enough to compensate for that massive loss you’ve just incurred. Hold and hope in mean reversion is one of the most dangerous things you can do. If you get an exit signal and it’s a loss, get out of the trade, move on to the next one, and keep those losses contained. If you let your losses get out of control, the expectancy of the system will fall apart, and you’ll end up with a massive drawdown and a huge financial headache.
Hold and hope is not a strategy!
Mean Reversion Mistake 5: Using Leverage And Large Position Size
The problem with leverage and large position sizes is when you backtest your trading strategy using leverage and large position size, it will tend to make a lot more money. It shows you this huge equity curve with rapid growth and higher compound annual return, and it’s really appealing… It is like a Siren’s Call that lures sailors onto the rocks.
The trouble is, the more leverage and the larger your position size, the higher your risk of ruin. The risk of ruin is something that the backtest often does not fully communicate because the backtest shows only one possible history. Traders need to look beyond the alluring returns in the backtest to understand the true risk they are taking on.
With leverage and large position sizes, what will happen when you get that inevitable large loss, and it turns out to be bigger than expected?
Leverage and large position sizes can wipe you out when trading with mean reversion. I prefer to use 15 or 20 small, equally sized positions when position sizing for mean reversion. I don’t use leverage on mean reversion because I don’t want to get wiped out. If you want to stay in the game and avoid massive drawdowns, then using leverage in large position sizes in mean reversion is something you want to avoid.
Mean Reversion Mistake 6: Sloppy Order Entry Or Wrong Order Types
With mean reversion, I have already mentioned that the average profit per trade is very small. Therefore, you must ensure you don’t incur too much slippage. If you’re trading super high liquidity stocks or ETFs, this won’t matter much and you can use market orders to enter and exit, but if you’re trading anything else, limit orders are a much better way.
There are several trading order type scenarios for you to consider for mean reversion trading:
- If you are trading stocks and your mean reversion system calls for you to enter at the open, you will want to participate in the opening price match to minimise (eliminate) slippage. The best way to do this is to submit a limit order at a price level high enough (if you are buying) or low enough (if you are selling) that will be executed on the open.
- If your trading system requires you to exit at the close of the day, then using a Market On Close Order (MOC Order), if it is available on your exchange, will ensure you get the official closing price. If you need to exit at the close and your exchange does not have the MOC order type (for example, the ASX), then you need to submit a Market Order as ‘Good-After-Time’ just a few minutes before the close.
- If your mean reversion system uses a limit order stretch to magnify the edge then your entry will not have slippage because it will only be executed at the limit order price or better.
Using a straight market order can be problematic, particularly on lower-liquidity stocks, because you will get a lot of slippage. Instead, consider using limit orders because you’ll get better fills at better prices. You may not get filled every time, but you’re not going to get the slippage and so your mean reversion edge is more likely to remain intact.
These are 6 of the most common mean reversion trading mistakes. If you can avoid those mistakes and follow a profitable mean-reversion trading system, your chances of success are astronomically higher.
The Best Trading Indicators for Mean Reversion Strategies
In this section I am going to discuss 5 mean reversion trading indicators that I use to catch the short term oversold conditions for long entries and overbought conditions for short entries. The 5 indicators are:
- Relative Strength Index
- Bollinger Bands
- Stochastic Oscillator
- Consecutive Up / Down Bars
- Internal Bar Strength
Mean Reversion Indicator 1: Relative Strength Index
The first indicator is the Relative Strength Index (RSI). You can see on the chart below that I’ve got a 3-period plotted RSI on the chart. The RSI identifies how extreme the price is over compared to the recent period. In this case, the last three bars.
When the RSI is at a positive extreme (greater than 70) the price has moved up very strongly relative to the last two bars of price movement. The opposite is true for low RSI readings. This is shown on the chart below, you can see there is a very strong negative price movement over a few days gives a very low RSI reading indicating a potentially good long side mean reversion entry.
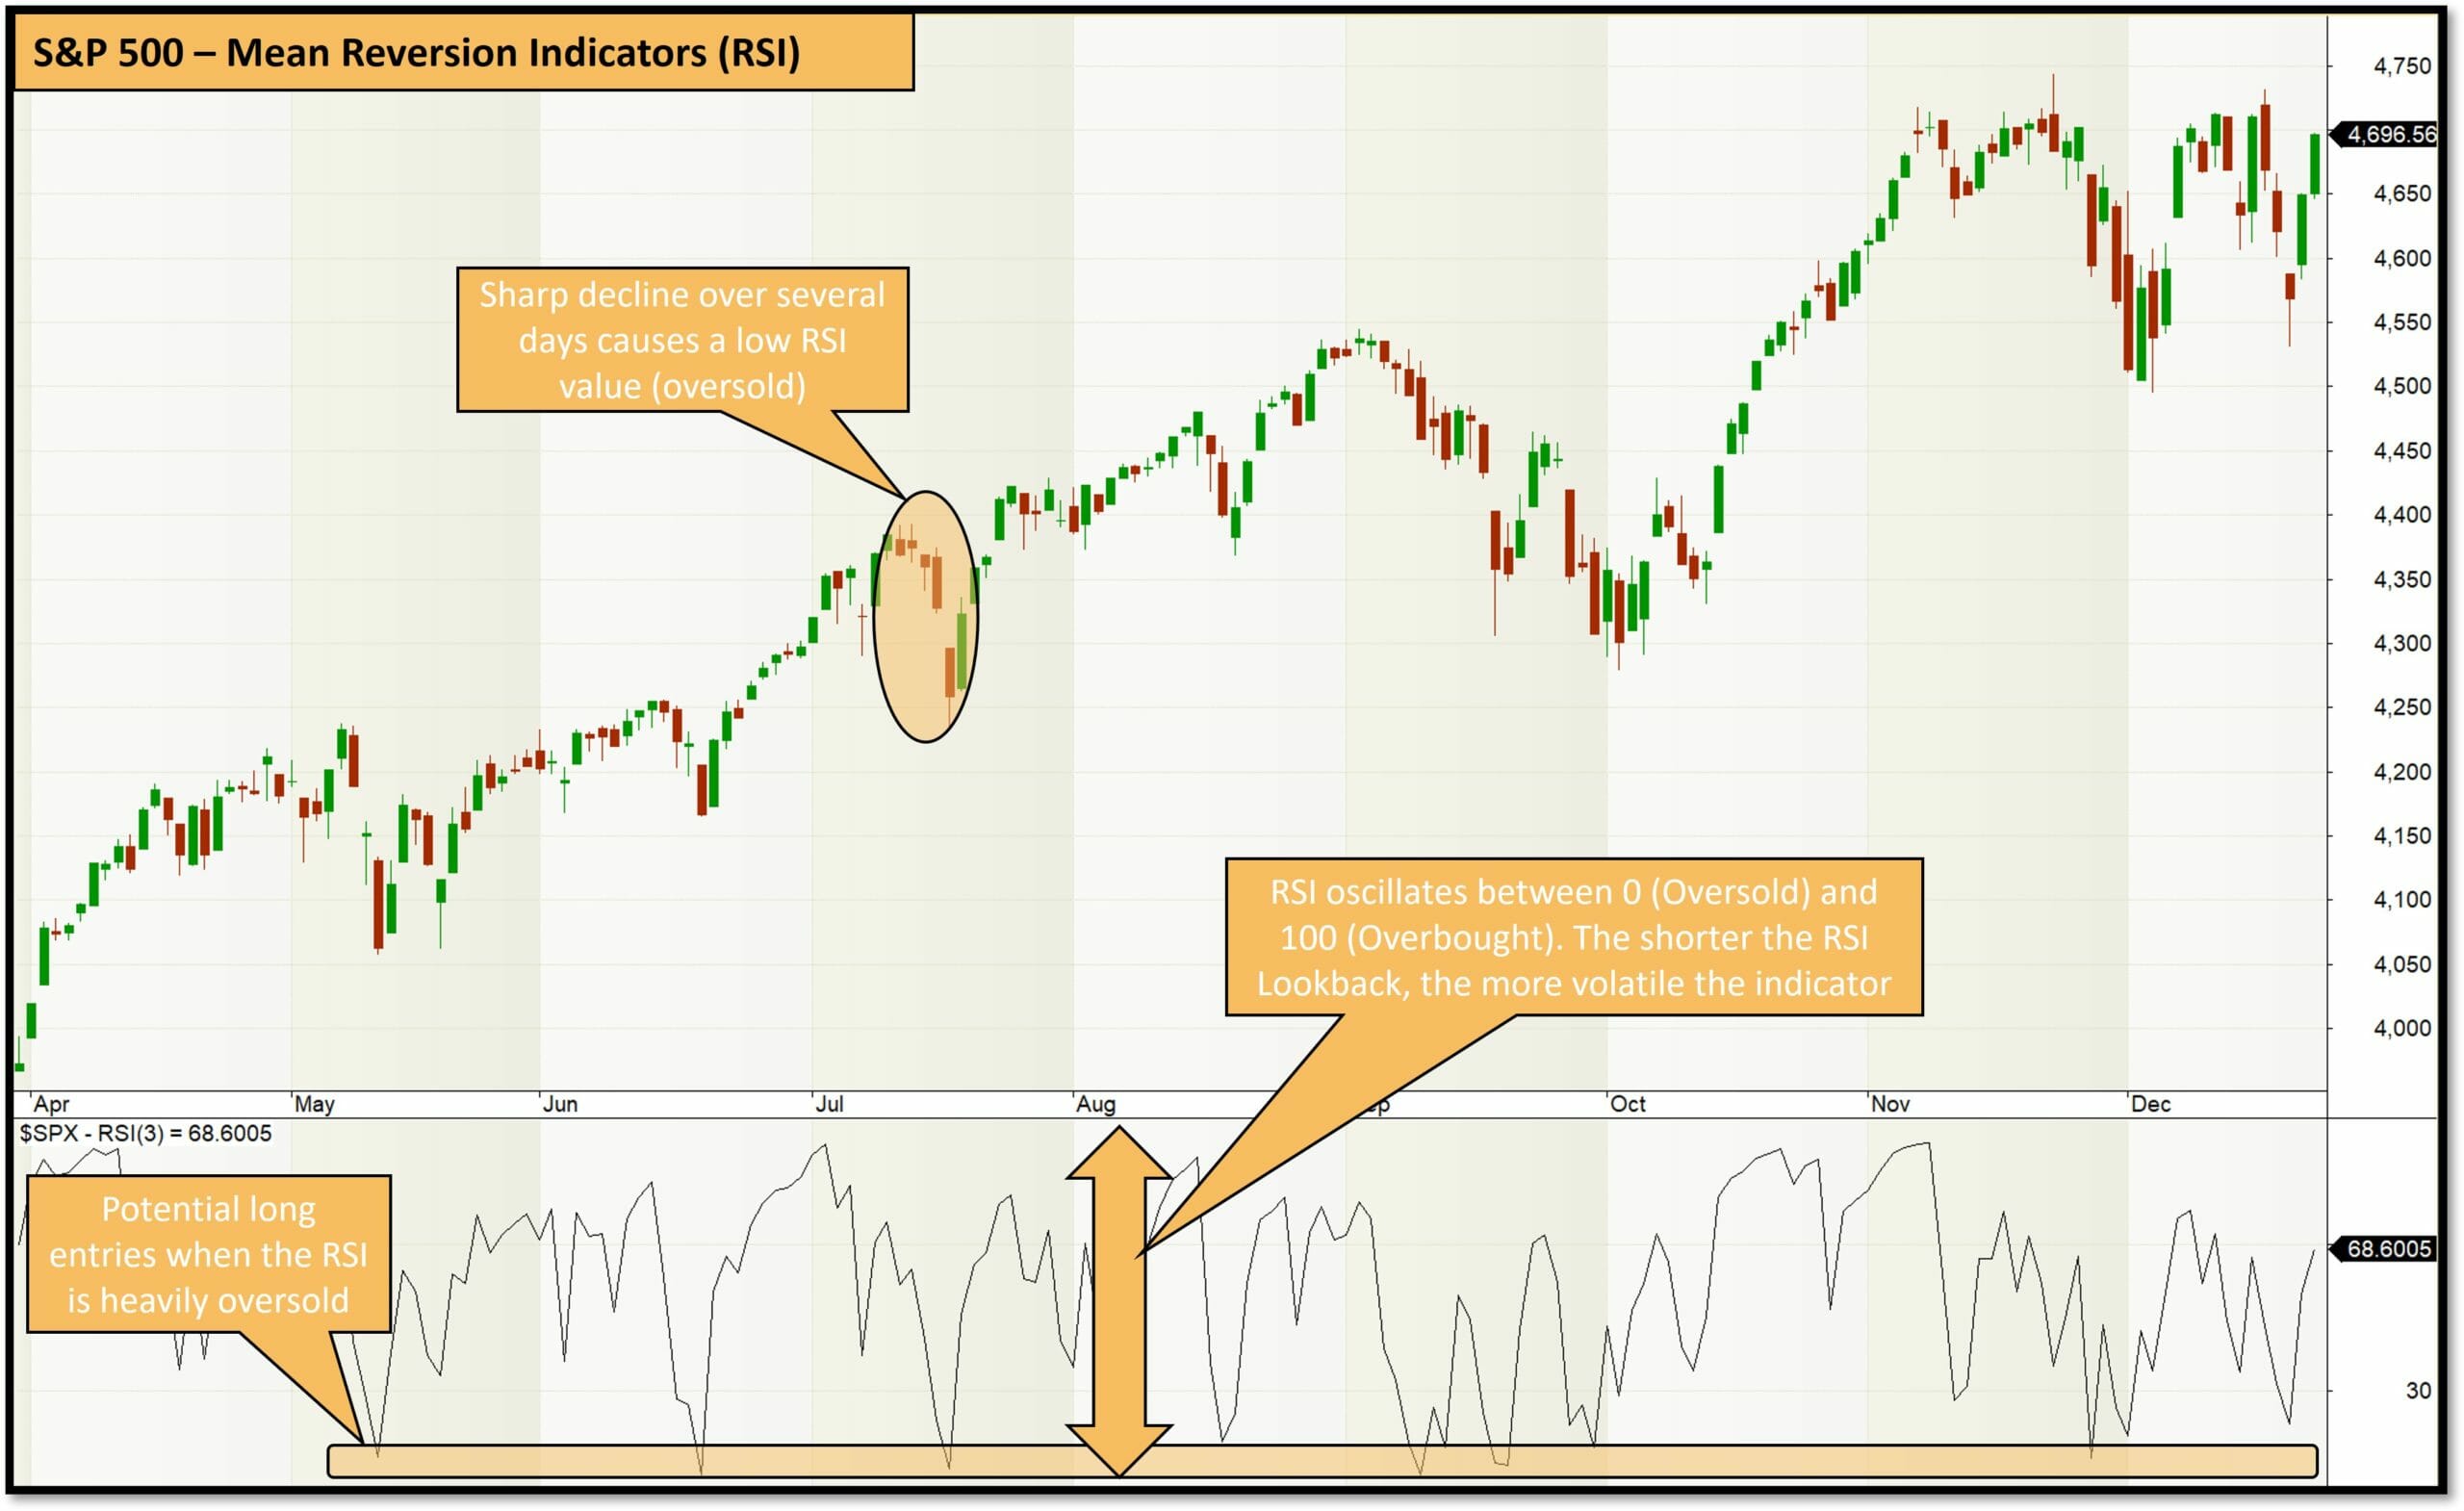
The RSI oscillates between 0 and 100. Depending on what period of RSI you use, those oscillations will be faster or slower. For instance, a two-period RSI, which is quite common for mean reversion trading strategies, is quite volatile wherein it fluctuates up and down very quickly. A 20-period RSI, which you might use to identify a longer-term pullback fluctuates much more slowly.
I like to use a two or three-period RSI on my chart in my mean reversion trading strategies because they do an excellent job at picking short-term reversal points, and short-term extremes, which is exactly what we want out of mean reversion. Importantly, the RSI should not be used on its own because one technical indicator is not a complete system. I also use a trend filter and a volatility filter to select high volatility stocks which provide good mean reversion returns.
For RSI 3, you might enter long when the RSI drops below maybe 5 or 10. For an RSI 2, you might enter when the RSI drops below a value of 2 or 3, depending on how frequently you want to trade. The way you would tune the system is that the more frequently you want to trade, the higher the threshold is where the RSI has to drop.
If the RSI has to drop down to a five, that will trade much less often than if you only require it to drop down to a value of 10. Thus, the RSI threshold for the entry is one of the critical components in your mean reversion trading strategy that you are going to vary and optimize to find the best values for your particular markets that you are trading.
Mean Reversion Indicator 2: Bollinger Bands
Bollinger Bands are the second mean reversion indicator I would like to discuss. A Bollinger Band is an indicator that measures extremes of price movement by wrapping standard deviation channels around a moving average. The chart below shows the 15-period Bollinger Band with two standard deviations. In this example you can see the 15-bar moving average through the middle of the price. Then, it adds two standard deviations of price above and two standard deviations below. As the price gets more volatile, the Bollinger Bands expand. As it gets less volatile, they contract.
As the price falls at an extreme low, it tends to go outside the lower Bollinger Band. This can be a useful long side mean reversion entry in a bull market. If you are looking at shorting a stock then shorting above the upper Bollinger Band in a bear market can be a good entry.
You can see that on the chart below. There’s a period where the volatility is expanding in the up move, and the Bollinger Bands are quite wide and further apart. There’s also a period where the price action has condensed and contracted, and the volatility is low, so the Bollinger Bands come together. This is how the Bollinger Bands measure volatility.
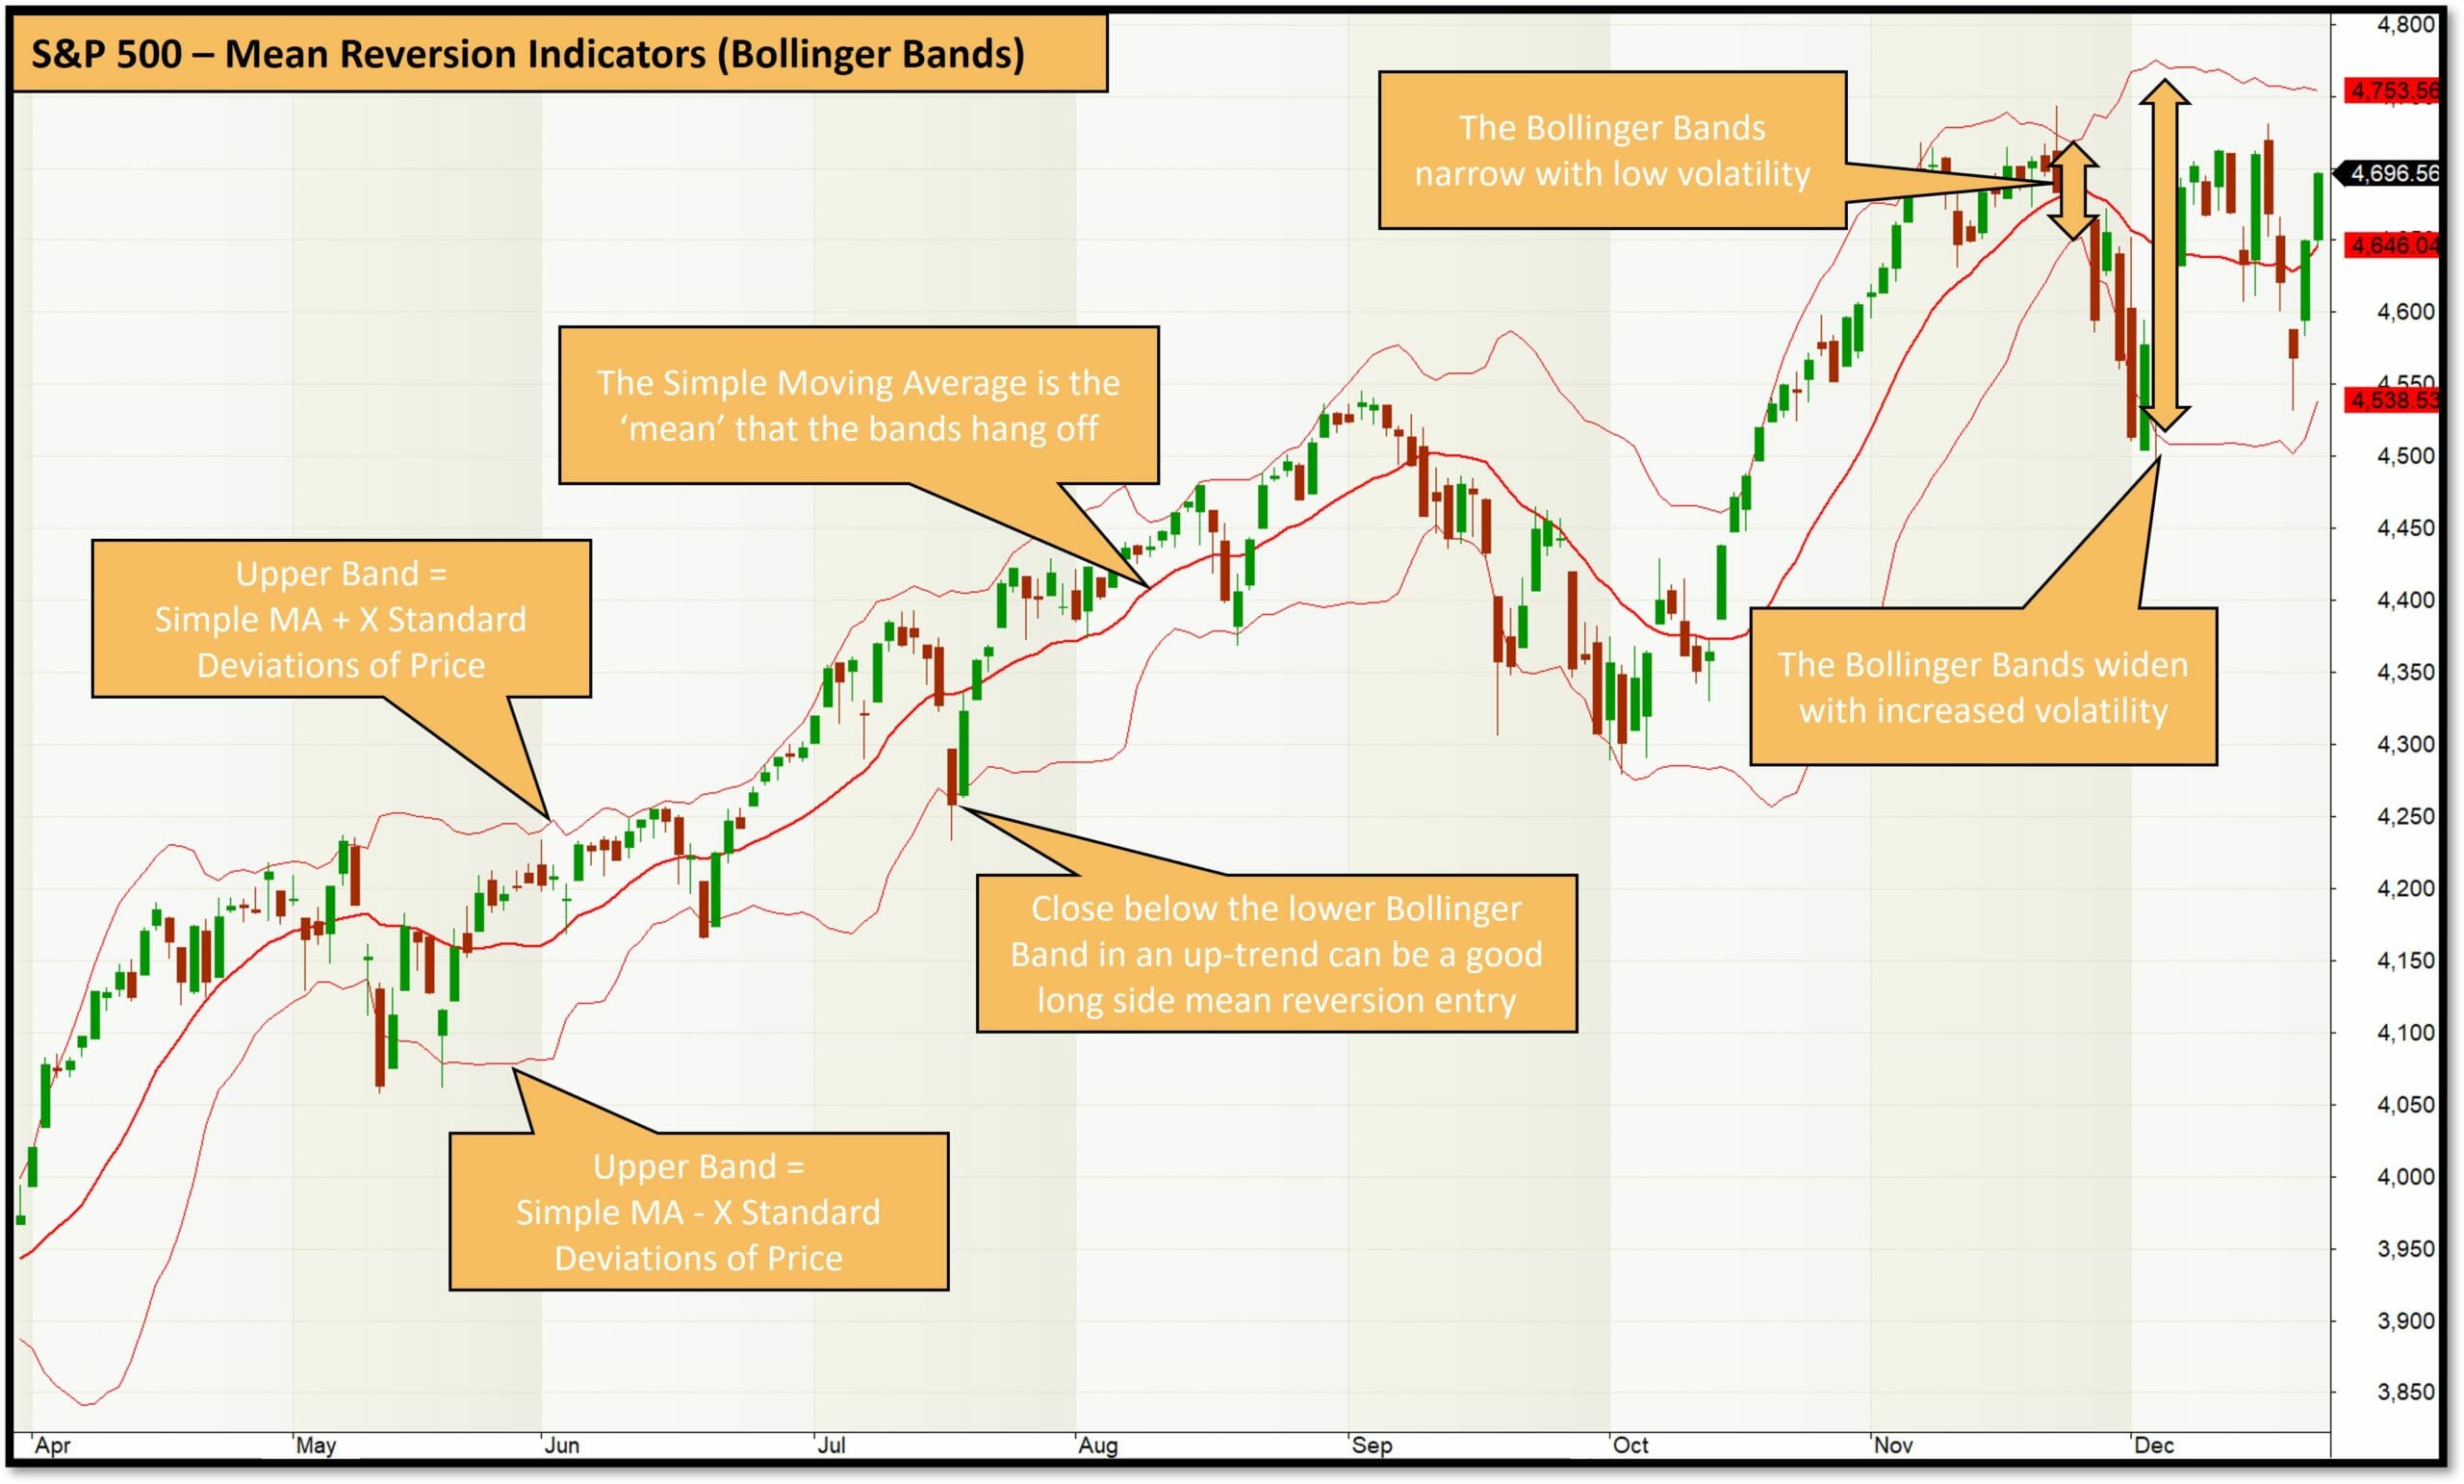
If the price is in an uptrend and falls below the lower Bollinger Band, that can be an excellent mean reversion entry. Similarly if price is in a down trend and there is a short term rally above the upper Bollinger Band that can be an excellent mean reversion short entry.
Mean Reversion Indicator 3: Stochastics
The third indicator that you can use for mean reversion trading is stochastics. Stochastics is probably one of the most well-known oscillators. They work in a similar way to RSI in that they’ll oscillate between 0 and 100. They’ll fall during a correction and rise during a rally.
You can see in the pane at the bottom on the chart below that the stochastics are up near the top when the price is moving up. When they have a sudden dip, the stochastics fall. You can enter long on a mean reversion strategy when the long-term trend is up, and the stochastics cross below a certain level.

One of the interesting things about mean reversion compared to trend following, is in mean reversion, you don’t wait for confirmation and you’re not waiting for the price to start rallying before you get in to ride the rest of the rebound. You’re buying on the move against the trend and you’re buying in anticipation of a bounce back.
That’s why in mean reversion trading strategies, whether it’s RSI or Bollinger Band or stochastics, you’ll tend to buy when that indicator crosses below a certain level or the price crosses below the Bollinger Band in the case of Bollinger Bands. You’re not waiting for it to cross back up because if you’re waiting for it to cross back up, it’s too late. You’ve missed the bounce, and there’s little profitability left.
You got to put your big boy pants or your big girl pants on, and you got to buy in the middle of the fear in order to be profitable with this trading strategy. That’s why psychologically mean version trading can be pretty challenging.
Mean Reversion Indicator 4: Consecutive Up / Down Days
The the fourth indicator I like to use for mean reversion trading is the number of consecutive bars that close in one direction. This is an excellent, simple indicator, which I love, particularly for mean reversion. What it does is you look at how many bars in a row the price has moved in a certain direction.
If we look on the chart below, I’ve plotted the number of consecutive up bars (red) and the number of consecutive down bars (green) below the price chart. In general, the number of consecutive up or down closes is low. Two, three, or four occasionally. But every now and then, there’s an extreme move where the price continues in the one direction for 5 or more bars in a row. These are the extremes we are looking for in a mean reversion entry. Note though that the extreme moves against the primary trend are the best entries for mean reversion because they are more frequently followed by a significant and tradeable reversal.

An extreme number of closes in one direction are good entries in a mean reversion trading strategy. For example, you might look for an up trend, and then you might wait for five bars down in a row in the middle of that uptrend and then enter on open the day after the fifth bar down. That would be a perfect place to enter because there tend to be fewer down days in a row in an uptrend so after 5 down days in a row, a reversal back to the trend is highly likely.
If you buy on the fourth, the fifth, or the sixth down day in a row during an up trend, there will often be a bounce very soon after that – The number of up or down bars in a row can be a powerful mean reversion entry signal
Mean Reversion Indicator 5: Internal Bar Strength
The next indicator that I want to discuss for mean reversion trading is internal bar strength. You can see on the chart below that it shows internal bar strength. What is internal bar strength before I get into how we use it?
Internal bar strength (IBS), measures where the share price closes relative to the trading day’s high and low. If it closes right in the middle of the high and the low, IBS is 50. If it closes right at the top, the IBS is 100. If it closes right at the low, then the IBS is zero. Thus, how do we use this for mean reversion trading? Look at the chart of the S&P 500 again.

Using a real example on the S&P 500 Stock Index chart below we can see the highlighted bar opened at 4,204, and that was the high of the day. It went all the way down as low as 4164, and it closed just a smidge above that. If we look at the internal bar strength on this day, the internal bar strength was 0.05. This means that 95% of the price bar was above the close.
That’s a very over-sold day. A low IBS like this in an uptrend is a great place to enter long in a mean reversion trading strategy. Contrast that with the next bar, this bar opened at 4173 and it moved up and closed at 4224. The high was just a smidge above that. That IBS or the internal bar strength for that bar is 0.97, which means that 97% of the price bar on that particular day was below the close. That’s more like an overbought day.

In an up trend, in a bull market, we’re looking for a dip to buy in anticipation of a bounce for mean reversion. In a downtrend, in a bear market, we’re looking for a rally to short-sell in anticipation of a correction back down to the trend in a down market.
We are looking for a low IBS to buy for a bounce in a bull market. In a bear market, we’re looking for a high IBS to short in anticipation of a collapse. That is how you would use internal bar strength. As you can see, it fluctuates back and forth very quickly. Thus, internal bar strength does give you a large number of signals.
There are a few different ways you can do this. You might average the IBS over a couple of different days or use it as one extra filter in your trading strategy. There are several different ways you can incorporate this. However, these five indicators are really powerful, and I’ve got trading systems that have used all of these to develop mean reversion trading systems.
The five indicators that we went through for your mean reversion trading strategies are the relative strength index (RSI), Bollinger Bands, the stochastic indicator, the number of consecutive up or down bars, and internal bar strength.
There are many other indicators that you could use for mean reversion trading. Any oscillator can be adapted for mean reversion trading, which looks for oversold and overboard levels. However, these are five that I’ve used and found quite some success. You may have others, but these are a great place to start for your mean reversion trading strategies.
Example Mean Reversion Trading Strategy
So far in this articles, I’ve discussed what mean reversion is, how it works, some common mistakes, and some of the best indicators for mean reversion trading. Now let’s pull all that together into a trading strategy that works. However, before we go any further, I don’t recommend you trade this strategy straight off the website. It is profitable in the backtest, but if you want to trade a strategy, you need to work on it and learn to backtest, optimize, and fine-tune that strategy to ensure it fits you, your personality, objectives, and lifestyle.
If you need to learn how to do that, check out the link below and join The Trader Success System. In this premium mentoring program I’ll teach you how to develop, test, optimize, and fine-tune trading systems for yourself and assemble a portfolio of diversified trading strategies that trade across multiple strategies, markets, and timeframes.
Now, back to the mean reversion trading strategy example.
First, I’m backtesting this strategy today in Amibroker. If you haven’t used Amibroker before, this may be daunting, but it’s simple enough once you get the hang of it and I explain how to do everything in detail in The Trader Success System. Let’s go through the trading rules for our example mean reversion trading system.
Example Mean Reversion Trading System Rules
- Trend Filter: Our trend filter says that the price has to be above the long-term exponential moving average, which is a 200-bar moving average. This ensures we only trade long during a bull market
- Volatility Filter: We also have an Average True Range volatility filter. We want high volatility stocks so the average true range divided by the closing price has to be greater than 0.08. This is quite a volatile stock that it’s trading. If a stock is quiet, it won’t take a signal in that trade since it requires volatile stocks. The reason is the more volatile the stock, the higher the average profit per trade and the better the system will perform, provided you get enough trades.
- Liquidity Filter: We also have a liquidity filter, which requires that over the last 20 days, on average, the stock has turned over more than a million dollars per day. You can make this number higher or lower depending on your account size and how big your positions will be.
- Minimum Price Filter: We have a minimum price filter based on the original unadjusted closing price before any splits adjustment. This is provided by Norgate Data which I use and recommend for backtesting. The share price has to be above $5 per share because I want to avoid trading penny stocks with this since the commission drag gets too high.
- Entry Trigger: We are going to enter when the RSI(3) crosses below a value of 5 provided all of the above rules are true.
- Exit Rule 1: We will sell if the closing price exceeds the three-bar exponential moving average. That’s just a little rally after we enter, and then we’ll get out.
- Exit Rule 2: We will exit if the stock closes below the long-term moving average, which is the opposite of this trend filter. If that trend filter is no longer true, we will get out because we don’t want to hold a long position in a mean reversion strategy in a downtrend because that’s very dangerous.
- Position Score: The position score is the rule that ranks trade. If you get more signals and have available capital, the trade with the highest position score gets the capital first, and you go down the list in order of highest to lowest position score. That way, you don’t have to make any subjective decisions about which trades you take or don’t.
- Initial Stop Loss: The initial stop loss is 40% wide, so this is a disaster stop. If that 40% stop loss gets hit, we will wait to re-enter that trade for five days.
- Reentry Delay: We have a five-day re-entry delay because if the stop loss gets hit, that’s because the price that stops, the stock is falling, and the price gets hit. That’s typically at a point where the stock is heavily oversold. If you don’t have a re-entry delay, the very next day, you’re going to get a buy signal. What can happen is you have an oversold stock, you buy it, and then it hits the stop loss, then you buy it again, and then it repeats. You don’t want to be constantly chasing good money after bad. That’s why I’ve got a re-entry delay. If the stop loss gets hit, you let it cool down for a bit; then, if it goes oversold, you can buy the stock again.
- Position Sizing: Position sizing is a simple 10% of equity position size, so ten equal positions in this system.
But what market are we trading this system on?
You’re probably thinking, “Oh, this is an S&P 500 stock system right?” And, no, it’s not because many mean reversion trading strategies, particularly ones that enter at the open, have lost their edges in the S&P500 stock universe in recent years. They have decayed over the last decade or so at the top end of the US markets. There are still mean reversion strategies that work in those markets. However, I’ve chosen to demonstrate this system in the Canadian markets.
The reason I chose the Canadian stockmarket (Toronto Sock Exchange) is more stocks are quite volatile and this style of mean reversion system still works very well. My suspicion is because there is no automated high-frequency trading in Canada short term strategies like this still work well – They worked extremely well in the US market in the late 1990’s and early 2000’s before the advent of high frequency trading. In Canada there are restrictions on automated and high frequency trading (note: I think this is a GOOD THING. It means the HFT firms can’t steal from every day investors like they do in the US markets).
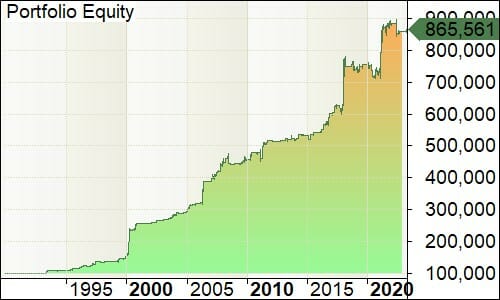
Thus, if you have this system, you apply it to the Canadian markets since it works well as you can see in the backtest results below. I have applied this example mean reversion trading system to all stocks on the Toronto Stock Exchange, including delisted ones, so these results have no survivorship bias. The backtest is run from 1990 to today and these system parameters have not been optimized or fine-tuned, so there is definitely room for improvement!
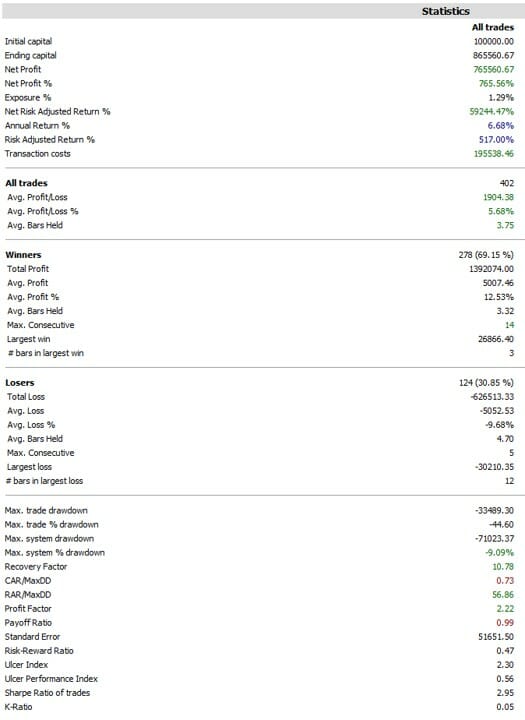
Of course this system this could be better since it has not been optimized or fine-tuned at all (I just made up the rules and backtested them). However, the annual return for this strategy is 6.7%, and it’s only in the market 1.29% of the time. That means you’re making a 6.7% return while being invested less than 2% of the time!
That’s pretty damn good!
The risk adjusted return for this strategy is high, 517%. Risk adjusted return is annual return divided by exposure. This means that for the time it’s in the market, our example trading system makes excellent returns. It’s got 402 trades; 69% were profitable, and the average profit per trade was 5.68%.
Note that I have even included a decent allowance for commissions here so I am not cheating to just to show you a profitable backtest 😉
One of the great things about the Canadian market and trading volatile stocks is that you get much better average profits per trade than in some other markets. The max drawdown for this strategy for this system was 9%. So the CAR/Max Drawdown is 0.73. Not spectacular, but it’s a pretty good starting point.
On the equity curve, you can see from 1990 to today that it has steadily increased. It looks like it may have decayed a little, but the strategy is relatively stable and it hasn’t lost its edge, which is excellent.

The drawdown profile is relatively stable. We’ve had a couple of drawdowns around the 7% level. More recently, in COVID, a drawdown of just a little over 9% by the look of it, so not too bad. That is a good starting point. This is a mean reversion trading strategy that you could adjust, adapt, and maybe apply to some different markets and see what happens.
One of the big lessons I have learned trading for so long is that you want to avoid getting stuck just thinking about your home market. If you’re a US trader, you think, “Well, I only trade stocks in the S&P 500.” You may leave a lot of money on the table. You can get some significant diversification and find even bigger edges by trading international markets; it’s super easy to trade internationally. Also, by trading different strategies in different timeframes and markets, you can further improve your results.
That’s precisely what I teach in The Trader Success System. I show traders how to develop and implement portfolios of trading systems that give them diversification across different strategies, different markets, and different timeframes. I also put you in the driver’s seat by not only giving you systems (I give you several dozen systems when you join) but also by showing you exactly how to evaluate those systems to make sure that they’re profitable and that they fit you and your objectives.
My whole goal is by the end of The Trader Success System, you’ve learned how to evaluate any trading system fully. Not just mine, but when you find one in a book or someone else’s course or online somewhere, you’ve learned to evaluate it and test it to build confidence about whether or not you want to trade it. Then, you know how to incorporate it into your portfolio to get a diversified portfolio across different strategies, markets, and timeframes because diversification is the magic in systematic trading.
So if you want to master systematic trading and quickly build a diversified portfolio of trading systems covering multiple strategies / markets / timeframes, click the button below to join The Trader Success System today!


Thank you very much, Adrian. I’ve long been looking for a holistic, all-encompassing analysis of Mean Reversion. Here it is.
A mean reversion exit has to occur very quickly, as you’ve clearly pointed out. So, does this approach also work on higher time frames than daily? For example, exit after a green weekly or even monthly candle?
Hi Steph,
I am really glad you have found my article on Mean Reversion helpful – thank you so much for reading! I would say yes these concepts do work on higher timeframes as well. I have successfully developed mean reversion strategies on weekly charts so I know that does for sure. I have not tried monthly yet but would be interested to have a look.
Adrian