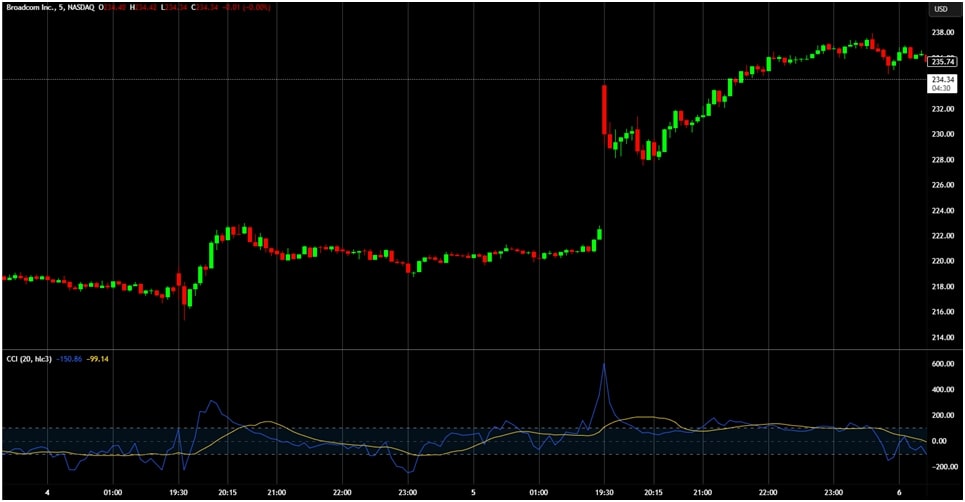
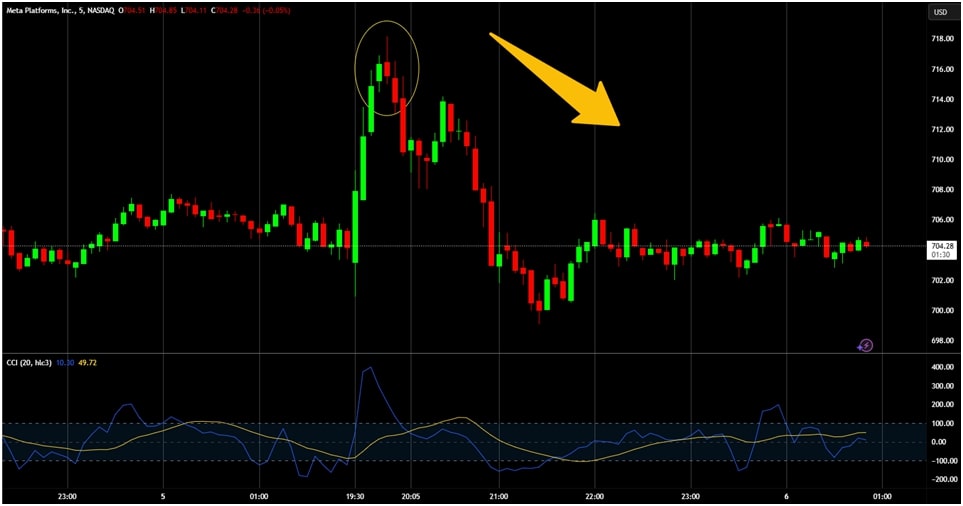
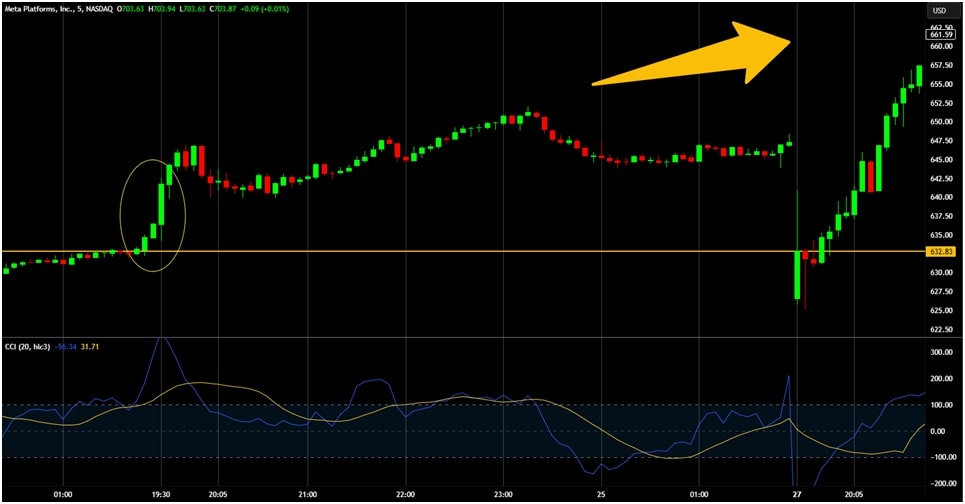
The Commodity Channel Index (CCI) is a versatile momentum-based trading indicator that helps stock traders assess price movements relative to their historical price chart. In simpler terms, the CCI indicator measures overbought or oversold levels, offering traders valuable insights into potential price reversals. Think of it like a speedometer in your car. Just as you monitor your speed to avoid speeding tickets, you use the CCI to track whether a stock is moving too far, too quickly, potentially a trade signal or correction.

While its roots are in the commodities market, the CCI’s value extends far beyond just commodities, proving invaluable for stock traders who want to make data-driven decisions. For systematic traders, this tool is especially beneficial because it encourages rule-based trading signals, helping traders avoid emotional pitfalls and false signals.
How the Commodity Channel Index (CCI) Works in Trading
The CCI is calculated by comparing the current price of an asset to its average price over a specific time period. The formula for calculating the CCI is:
CCI=(Price−MovingAverage)0.015×MeanDeviationCCI = \frac{(Price – Moving Average)}{0.015 \times Mean Deviation}CCI=0.015×MeanDeviation(Price−MovingAverage)
Here is what each terminology means if you are interested:
- The current price level refers to the typical price of the asset, which is the average of the high, low, and close price extremes for each period.
- The moving Average price level is the simple moving average (SMA) of the typical price over a chosen period, typically 14 days.
- Mean Deviation is the average of the absolute differences between the typical price and the moving average over the same period.
The result of this calculation is plotted as an oscillator, which fluctuates between positive and negative values. A CCI above +100 indicates the asset might be overbought, suggesting that a potential price correction could be imminent. A CCI below -100 typically signals an oversold condition, implying that a price rebound might be around the corner.
Using the CCI in Stock Trading
For stock traders, the CCI indicator offers insights that can be used in various ways. Let’s go through the main ones:
- Overbought and Oversold Conditions: As mentioned, a CCI above +100 indicates an overbought stock, suggesting the overbought levels of price may be due for a pullback. Similarly, a CCI below -100 points to an oversold level of stock, which could be a versatile indicator of a potential buying opportunity.

- Trend Reversals: The CCI can also help detect cyclical trend reversals. For instance, if the CCI crosses above +100 and the price breaks a key resistance level, this may be a bullish signal at the start of an uptrend. Conversely, when the CCI drops below -100 and the price breaks below support, it may indicate the beginning of a downtrend.

- Divergence: Bullish or bearish divergence occurs when the CCI fails to confirm price movements. For example, if the average price level of a stock makes a new high, but the CCI fails to surpass its previous high, this could signal weakening momentum and a potential reversal.
Comparing CCI to Other Indicators
The Commodity Channel Index (CCI) is a versatile momentum indicator, but it is essential to understand how it compares to other commonly used tools in technical analysis. In this section, we’ll compare the CCI indicator with a few other popular indicators, such as the Relative Strength Index (RSI), the Moving Average Convergence Divergence (MACD), and the Stochastic Oscillator.
CCI vs. Moving Average Convergence Divergence (MACD)
The Moving Average Convergence Divergence (MACD) tracks the relationship between short-term and long-term moving averages (commonly 12-day and 26-day EMAs). The MACD line crossing the signal line is used to identify trend direction and reversals.
- MACD: Helps traders identify the trend direction (bullish or bearish) and measure trend momentum. However, the MACD can lag because it is based on historical data, making it slower to react.
- CCI: The CCI is a leading indicator, providing earlier signals of potential trend changes by measuring how much the current price deviates from its average. This allows the CCI to give earlier warnings of reversals compared to the MACD.
When combined, the CCI alerts traders to possible reversals, while the MACD confirms trend strength, helping to time entries and exits more effectively.
CCI vs. Stochastic Oscillator
The Stochastic Oscillator compares the closing price to its price range over a set period (usually 14 days). It oscillates between 0 and 100, with readings above 80 signaling overbought and below 20 suggesting oversold.
- Stochastic Oscillator: Primarily used to identify overbought and oversold conditions, especially in range-bound markets where price oscillates between support and resistance.
- CCI: While the CCI also identifies overbought and oversold conditions, it takes a broader view by comparing price to its moving average. This provides a better understanding of trend strength and bullish divergence, making it more adaptable in trending markets.
While both indicators measure momentum, the CCI offers a more comprehensive approach, especially in trending markets, whereas the Stochastic Oscillator is more focused on short-term price action.
Systematic Trading Perspective: Why Rules Matter
Systematic trading is all about consistency, and the key to consistency lies in the development and application of objective rules. Emotional decisions based on fear or greed can wreak havoc on a trader’s performance, leading to inconsistent results. When using indicators like the CCI, having well-defined rules ensures that traders make decisions based on data, not impulses.
For instance, a systematic trader might define specific CCI-based rules for entry and exit:
- Entry Rule: Buy when the CCI crosses above +100 and the price is above a rising 50-day moving average.
- Exit Rule: Sell signal appears when the CCI falls below -100 or the price drops below a key support level.
These rules eliminate guesswork, making the trading process more structured and measurable.
Backtesting the CCI
One of the significant benefits of systematic trading is the ability to backtest trading strategies. Backtesting involves applying a trading strategy to historical data to determine its effectiveness. Traders can test the CCI within their trading systems to see if it consistently provides valuable signals in various market conditions.
For example, a trader might backtest a strategy where they only enter trades when the CCI crosses above +100 and the stock is in an uptrend. By running this strategy against past data, traders can see whether the strategy has historically produced consistent profits and minimized drawdowns. If the strategy shows positive results, it can be applied with confidence going forward.
Challenges of Using the Commodity Channel Index (CCI) in a Trading System
While the CCI can be a valuable tool, like any technical indicator, it’s not without its challenges. Traders who rely solely on the CCI without understanding its limitations may run into difficulties. Here are some common pitfalls:
Over-Reliance on Extreme Values
The CCI’s primary function is to highlight overbought and oversold conditions. However, many traders make the mistake of blindly acting on these extremes. A CCI above +100 or below -100 is not always a signal to trade. In strong trending markets, stocks can remain overbought or oversold for long periods without reversing. For example, during an uptrend, the CCI may stay above +100 for extended periods without signaling a reversal.

Over-Optimization
A common trap is over-optimizing the CCI’s parameters based on past performance. Traders may tweak the period or the thresholds to match historical data, leading to overfitting. This means the strategy may perform well in backtests but fail in real market conditions. It’s important to avoid fine-tuning the indicator too much to the point where it becomes tailored to past data rather than future predictions.
Mitigating Challenges
To overcome these challenges, you may choose to take the following steps:
- Combine the CCI with Other Indicators: Use other technical analysis tools like moving averages, trendlines, or other oscillators to confirm CCI signals. For example, a long entry can be validated by both a CCI crossing above +100 and the stock breaking above a key resistance level.
- Avoid Over-optimization: Instead of fine-tuning the CCI’s parameters to fit past data, focus on testing the indicator across a variety of market conditions to understand its effectiveness and stability.
Actionable Tips for Using the Commodity Channel Index (CCI) Effectively
While there are tons of CCI indicator strategies, only a few are handpicked by top traders. Here are some actionable strategies to incorporate the CCI into your trading system.
Trend-Following Strategy
The CCI is great for identifying trends and following them. One effective way to use the CCI is to combine it with other trend indicators, like moving averages. For example:
- Buy when the CCI crosses above +100, and the stock is trading above its 50-day moving average.
- A sell signal appears when the CCI crosses below -100, and the stock drops below the 50-day moving average.
Mean Reversion Strategy
In choppy or sideways markets, the CCI can help identify potential mean reversions. When the CCI reaches extreme values (+200 or -200), it suggests that the stock might soon return to its average price. This strategy works best in market environments that are not trending but are fluctuating within a range.
- Buy when the CCI falls below -200 and starts to rise above -100.
- Sell when the CCI exceeds +200 and starts to fall back toward +100.
Divergence Strategy
Divergence can be one of the most powerful signals when using the CCI. Divergence occurs when the price moves in one direction while the CCI moves in the opposite direction. For example, if a stock makes a new high, but the CCI fails to make a new high, this could signal weakening momentum and a potential reversal.
- Buy when the lowest price emerges, but the CCI makes a higher low (bullish divergence).
- Sell when the price makes a higher high, but the CCI makes a lower high (bearish divergence).
Best Market Conditions for the CCI
The CCI is most effective in those market trends where clear directional movements are present. It can be less reliable in sideways or choppy markets, where the price fluctuates without a clear trend. It’s best used in combination with other trend-following tools to ensure that the signals are validated before making a trade.
Conclusion and Next Steps
The Commodity Channel Index (CCI) is a powerful tool for stock traders looking to gain insights into overbought and oversold conditions, trend reversals, and price momentum. By using the CCI within a systematic trading framework, traders can eliminate emotional decision-making and start trading with consistent, data-driven strategies.
However, like any tool, the CCI must be used thoughtfully. It’s essential to combine it with other technical indicators, avoid over-optimization, and backtest trading strategies to ensure that it’s effective in your unique trading style and market volatility.
If you’re serious about building a profitable, rule-based trading system, The Trader Success System can help you get started. This program offers a structured approach to mastering systematic trading so you can start making consistent profits and avoid the common pitfalls of discretionary trading.


