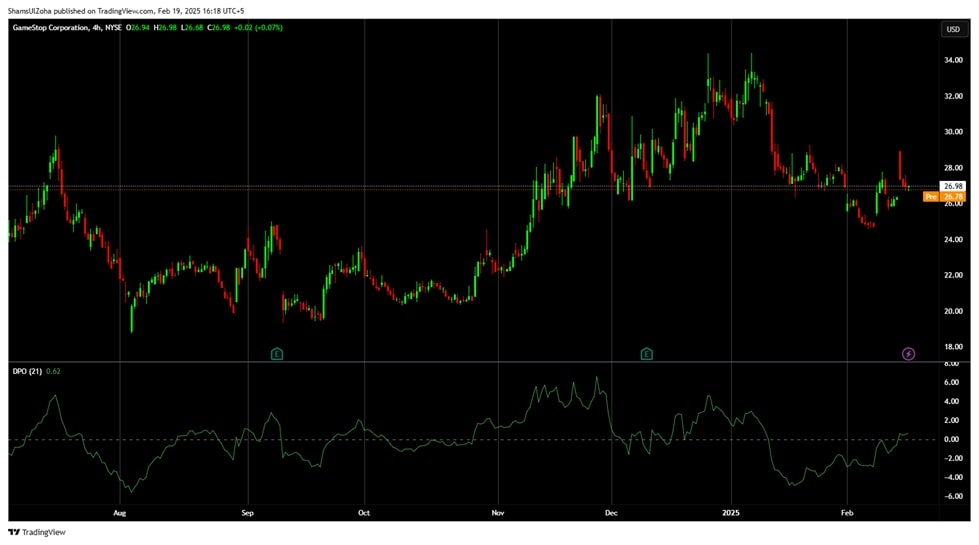
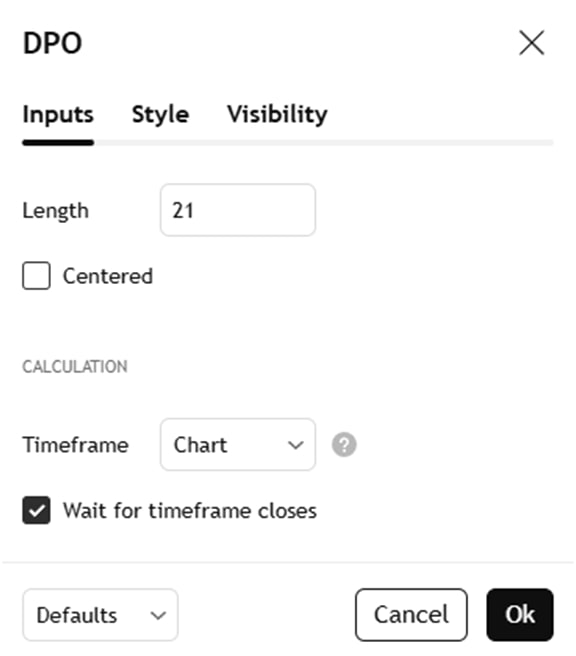
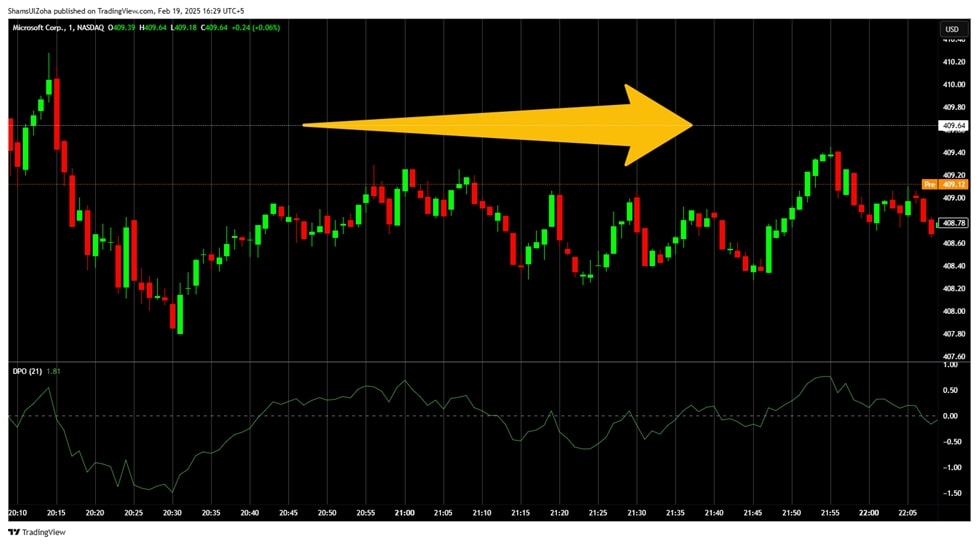
The Detrended Price Oscillator (DPO) is a technical analysis trading indicator used to remove trends from price data, helping traders focus on shorter-term cycles. Essentially, DPO attempts to remove trends by stripping away the “noise” caused by long-term price movements, allowing traders to identify cycles that might otherwise be hidden.
Think of the DPO as cleaning a window: It removes long-term trends (dirt), offering a clear view of shorter-term price movements (cycles). For systematic traders, this is crucial because it allows for rules-based decision-making that aligns with investment objectives and risk tolerance.
For those focused on systematic trading, the DPO can be used to create reliable trading opportunities based on peaks and troughs rather than following arbitrary market noise. This is why it may be a valuable addition to your rules-based trading system.

How the Detrended Price Oscillator (DPO) Works in Trading
The DPO operates by calculating the difference between the current price and a displaced moving average (or a smoothed version). This removes the current trend component, leaving only the price cycles.
The formula for calculating the DPO typically involves the following steps:
- Calculate a simple moving average (SMA) over a set day period (e.g., 20 periods).
- Displace the SMA to the left by a fraction of the period (e.g., 11-period shift for a 20-period SMA).
- Subtract the displaced moving average from the current price.
- The result is a value that oscillates around zero, highlighting the cyclical nature of price movements.
Traders typically use the Detrended Price Oscillator indicator to identify overbought and oversold conditions, providing trading opportunities. When the price oscillates far from the zero line, it can signal an overextended cycle and a potential reversal. For example, if the DPO signals extreme levels, it may indicate that prices are due for a correction.

Detrended Price Oscillator vs. Other Indicators in Technical Analysis
The Detrended Price Oscillator (DPO) is often compared with other multiple technical indicators like the Relative Strength Index (RSI), Moving Average Convergence Divergence (MACD), and Percentage Price Oscillator (PPO). Each of these trading indicators helps traders analyze price movements, but the DPO is unique in its approach to removing trends.
DPO vs. RSI (Relative Strength Index)
The RSI measures the magnitude of recent price changes to evaluate overbought and oversold levels, typically using a 14-period setting. It oscillates between 0 and 100, with readings above 70 suggesting overbought conditions and readings below 30 indicating oversold conditions. RSI is primarily used to identify potential reversals based on momentum.
The DPO, however, isolates short-term price cycles by removing long-term trends. Rather than simply measuring whether an asset is overbought or oversold, the DPO is used to identify market cycles, making it valuable for traders seeking short-term opportunities.
DPO vs. MACD (Moving Average Convergence Divergence)
The MACD compares two exponential moving averages (EMAs) (e.g., 12-period and 26-period) to gauge momentum and trend strength. Crossing the zero line indicates potential buy or sell signals.
The DPO, in contrast, completely removes trend lines to focus on the cyclic behavior of price movements. This makes it particularly useful for traders who want to analyze price cycles without trend-based distortions.
DPO vs. Stochastic Oscillator
The Stochastic Oscillator compares an asset’s closing price to its price range over a set period to determine momentum.
The DPO works differently by focusing on the price of an asset minus its displaced moving average, helping to isolate peaks and troughs within price cycles.
Systematic Trading Perspective: Why Rules Matter
In systematic trading, objective, data-driven rules are applied rather than subjective judgments. The Detrended Price Oscillator fits well with this approach as it provides clear buy or sell signals based on quantifiable price cycles rather than subjective judgments.
Backtesting is key when using the DPO. By analyzing historical data, traders can fine-tune their trading strategies, identifying optimal DPO periods and entry/exit conditions. This helps reduce emotional biases and ensures consistent decision-making.
For example, a trader might use the DPO with other technical indicators like the MACD to confirm signals. Using a displaced moving average, traders can determine the best conditions for trading bullish or bearish signals.
Challenges of Using the Detrended Price Oscillator (DPO)
While the DPO is a valuable tool, it comes with challenges:
- Generate false signals: The DPO may give misleading signals in low-volatility or sideways markets.
- Lag: The DPO is calculated based on past price data, which may cause slight delays in signal generation.
- Over-optimization risk: Tuning DPO settings too finely can lead to curve fitting, making strategies ineffective in live trading.

To mitigate these challenges, traders should combine the DPO with other technical analysis tools, such as trend indicators and candlestick patterns.
Actionable Tips for Using the Detrended Price Oscillator Effectively
To maximize the effectiveness of the DPO, consider the following:
- Monitor Market Volatility: The DPO works best in stable or range-bound markets.
- Use Clear Entry/Exit Rules: Enter trades when the DPO crosses the zero line and exit when it returns to neutral levels.
Conclusion & Next Steps
In summary, the Detrended Price Oscillator (DPO) is a powerful technical analysis tool for traders focusing on price cycles rather than long-term trends. The DPO can be used to identify overbought and oversold levels, making it a valuable addition to rules-based trading systems.
If you’re ready to improve your trading today and avoid the pitfalls of discretionary decision-making, apply now to The Trader Success System. It’s designed to help you build trading strategies that are robust and proven to match your goals, lifestyle and risk tolerance.


