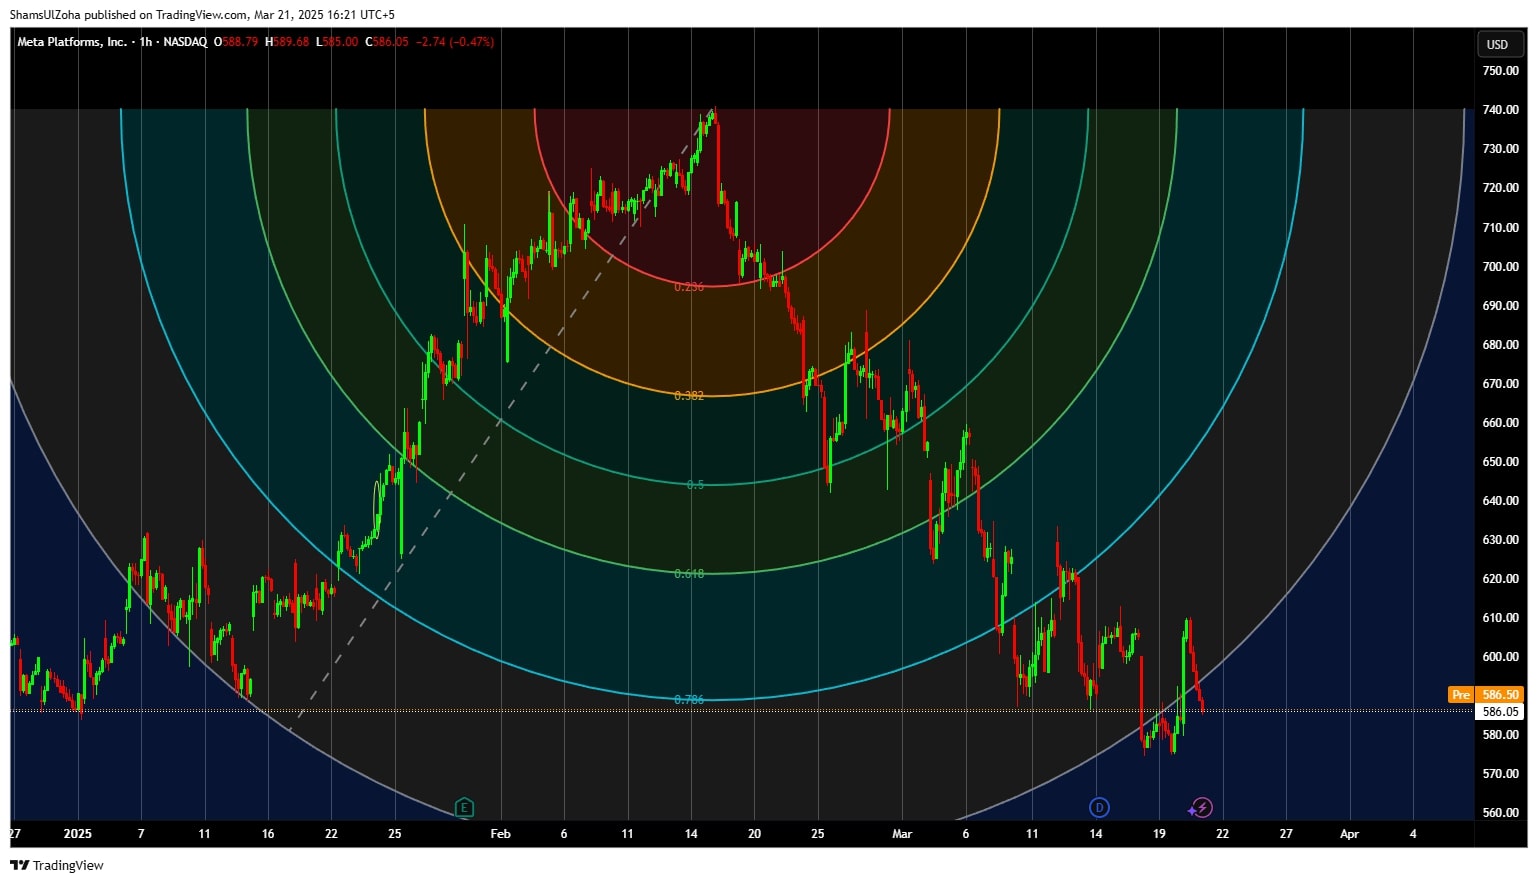
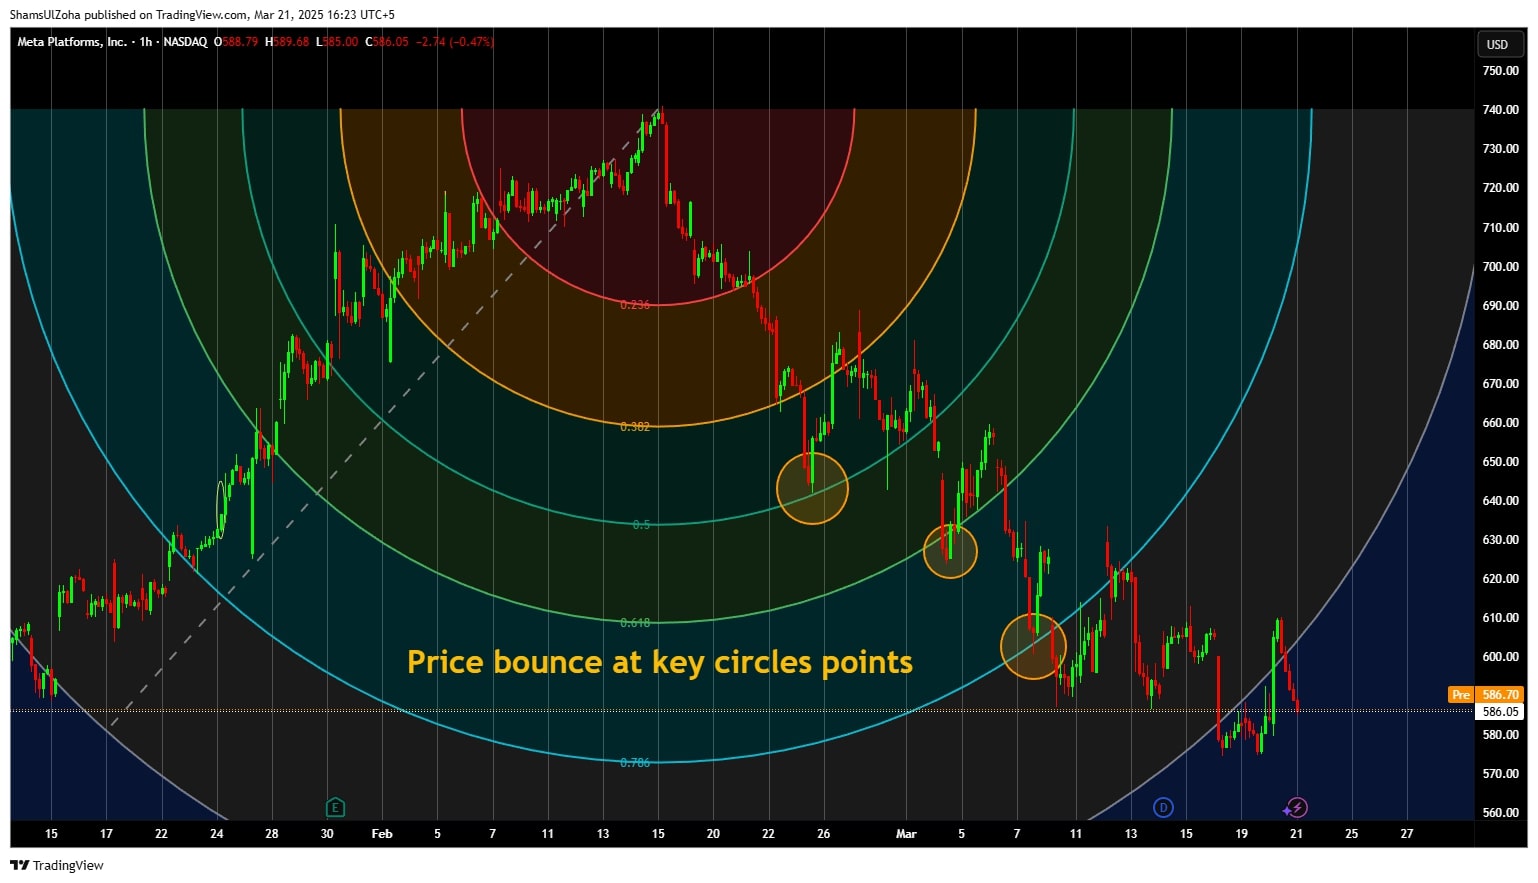
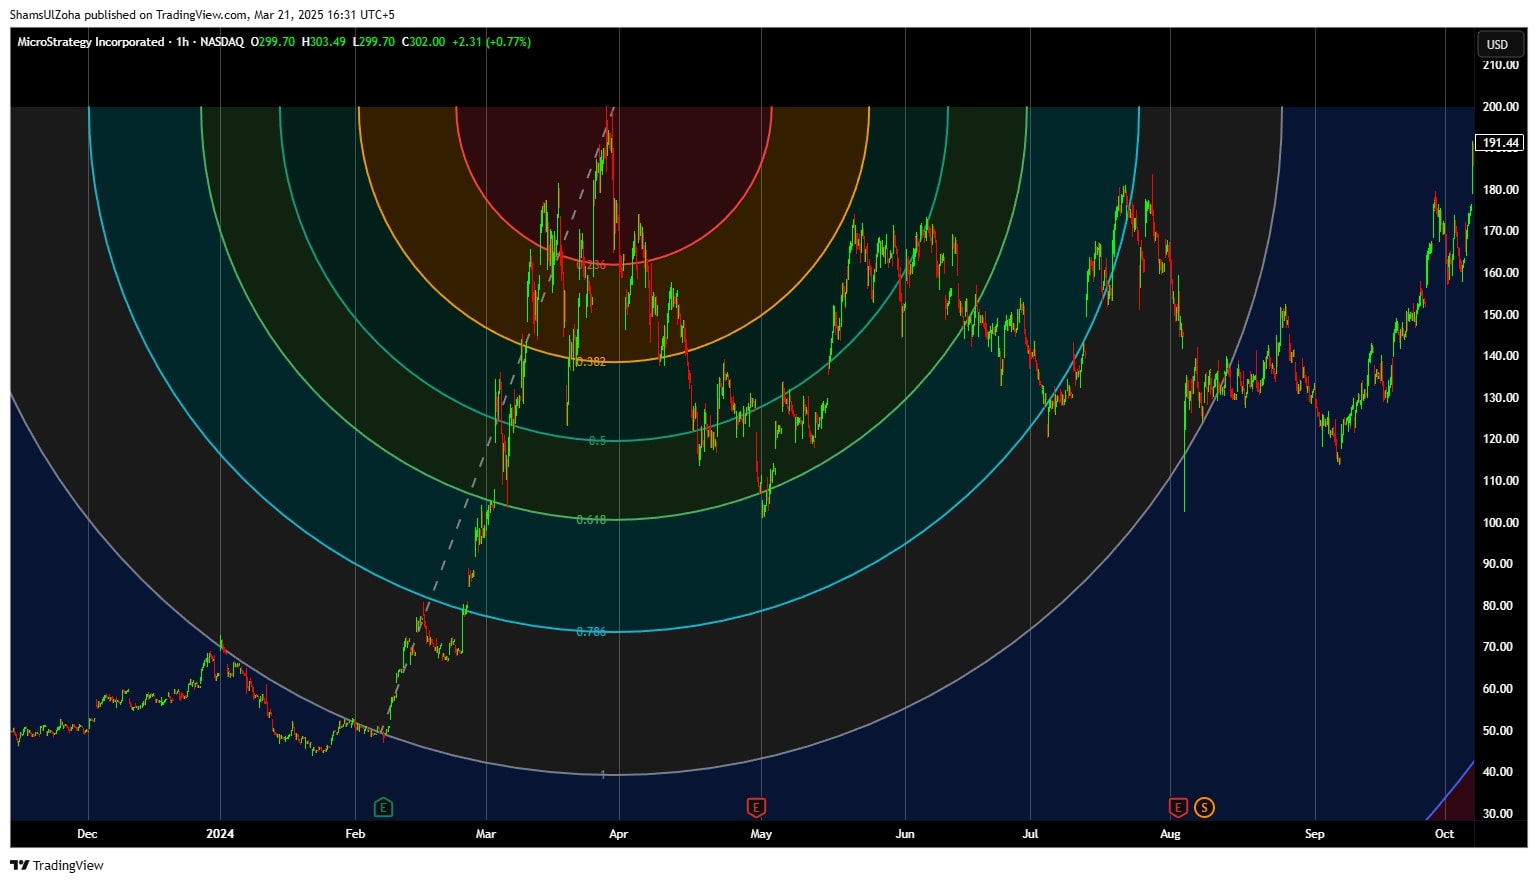
Fibonacci arcs are a trading indicator used for identifying potential support and resistance levels based on the Fibonacci sequence. These arcs are drawn using two extreme points, typically a swing high and swing low, and then projected outward using key Fibonacci ratios—38.2%, 50%, and 61.8%. The arcs mark potential support or resistance zones, helping traders anticipate price movement and possible reversals.

Think of Fibonacci arcs as circular arcs that help traders dynamically identify support and resistance areas. When price approaches these arcs, traders can assess whether the market will find support or resistance, leading to potential trading opportunities. Understanding Fibonacci arcs involves recognizing how price levels interact with these arcs drawn at key Fibonacci retracement levels.
How Fibonacci Arcs Work in Trading?
Fibonacci arcs are created by drawing circular arcs from a trendline that connects two extreme points—a swing high and a swing low. These arcs are displayed at the key Fibonacci retracement levels, 38.2%, 50%, and 61.8%, which are based on the Fibonacci sequence.
Once these arcs are then drawn on a chart, they serve as dynamic support and resistance levels. If prices approach the arcs, traders assess whether they will encounter resistance or find support. Fibonacci arcs provide traders a structured way to analyze price movement and anticipate reversals in support or resistance areas.

For example, traders might watch for a retracement if a stock approaches a 50% Fibonacci arc. If the stock rebounds at a Fibonacci arc, it could indicate a continuation of the trend. Conversely, if the price breaks through a key Fibonacci level, it could suggest a trend reversal.
Systematic Trading Perspective: Why Rules Matter
In systematic trading, every decision follows a set of rules. By incorporating Fibonacci arcs, traders can use Fibonacci principles objectively to determine entry and exit points. Traders use Fibonacci arcs alongside other Fibonacci studies, such as Fibonacci retracement levels and Fibonacci extensions, to confirm trading signals.
For instance, a trading strategy may involve buying when price approaches the 38.2% Fibonacci arc and selling when it reaches the 61.8% Fibonacci arc. Backtesting this strategy allows traders to determine the effectiveness of Fibonacci arcs in identifying potential support or resistance levels.

A key aspect of Fibonacci arcs is that they help traders make informed trading decisions without relying solely on Fibonacci levels. Instead, traders can combine Fibonacci arcs with trendlines, moving averages, and volume analysis to increase accuracy.
Challenges of Using Fibonacci Arcs in a Trading System
While Fibonacci arcs provide valuable insights, they are not infallible. One major challenge is misinterpreting Fibonacci arcs or over-optimizing trading decisions. If traders apply Fibonacci arcs too aggressively, they might generate false signals.
Fibonacci arcs marking support or resistance may also shift depending on market conditions. Traders should avoid relying solely on Fibonacci arcs and instead combine Fibonacci arcs with other indicators to confirm signals.
Another challenge is understanding Fibonacci arcs in different markets. In forex trading, for example, Fibonacci arcs intersect with speed resistance lines, requiring traders to adjust their interpretation of Fibonacci arcs.
Actionable Tips for Using Fibonacci Arcs Effectively
To maximize the effectiveness of Fibonacci arcs, follow these strategies:
- Combine with Other Indicators: To strengthen your analysis, use Fibonacci arcs with other technical tools like Fibonacci retracements, moving averages, or the Relative Strength Index (RSI). The convergence of multiple indicators at the same price level can provide stronger signals for support or resistance.
- Be Patient: Fibonacci arcs are best used in trending markets. Fibonacci arcs may not be as reliable in sideways or choppy market conditions. Wait for a clear trend to develop before applying them to your trades.
- Adjust the Scale: Since Fibonacci arcs are affected by the scale of your chart, experiment with different chart sizes to determine the most effective scale for drawing your arcs. This helps ensure that the arcs align with realistic support and resistance levels.
- Backtest for Confirmation: Before applying Fibonacci arcs in live trading, backtest your strategy across historical data to verify its effectiveness. This helps you refine your approach and increases your confidence in the tool’s predictive power.
Conclusion & Next Steps
Fibonacci arcs while an interesting concept, are in reality not an effective trading indicator for systematic traders because they lack objective, rule-based definitions that can be consistently quantified and backtested. The placement of arcs depends heavily on subjective interpretation of swing highs and lows, which can vary between traders and even between charting platforms. This subjectivity makes it impossible to code precise entry and exit rules or evaluate their historical performance with statistical rigor. Without the ability to backtest and validate their effectiveness using robust, repeatable methods, Fibonacci arcs cannot be relied upon in live trading, where consistency and replicability are essential for maintaining a genuine trading edge.
If you’re ready to take your trading to the next level, mastering tools like Fibonacci arcs and combining them with systematic trading principles will help you build consistent, profitable strategies. The Trader Success System offers step-by-step guidance to help you implement Fibonacci arcs and other proven strategies into your trading plan, ensuring long-term success in any market condition.


