Fibonacci retracements are a widely used trading indicator that helps traders identify potential support and resistance levels during price pullbacks. It allows traders to forecast where prices might reverse within a trend.
Imagine driving down a straight highway, and every time you approach a curve, there’s a sign indicating how much you’ve deviated from the straight path. These signs show you when to slow down and make adjustments. The power of Fibonacci retracement levels functions similarly, they help stock traders anticipate when to expect a price change or reversal during a trending market.
For systematic traders, applying Fibonacci retracements is essential because it allows for a structured, objective approach to identifying key Fibonacci levels in the market rather than relying on gut feelings or emotional reactions.
How Fibonacci Retracements Work in Trading?
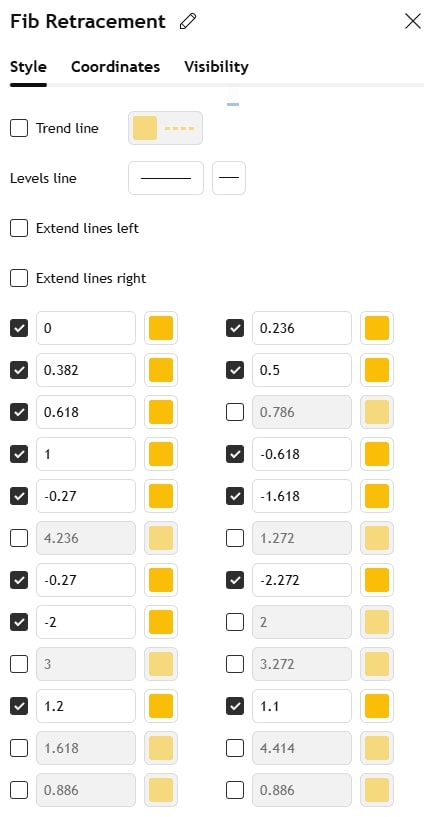
Fibonacci retracements are calculated by identifying the high and low points in a price move and then applying the Fibonacci ratios (23.6%, 38.2%, 50%, 61.8%) between these points. These percentages indicate where price corrections are likely to occur, acting as potential support and resistance levels.
For example, the price might rise from $100 to $150 during an uptrend. Using the Fibonacci retracement tool, traders obtain levels like $138.2, $130.8, and $116.6 as potential support zones. Traders watch these levels to determine entry and exit points for buying, assuming the price will bounce back to its previous trend.

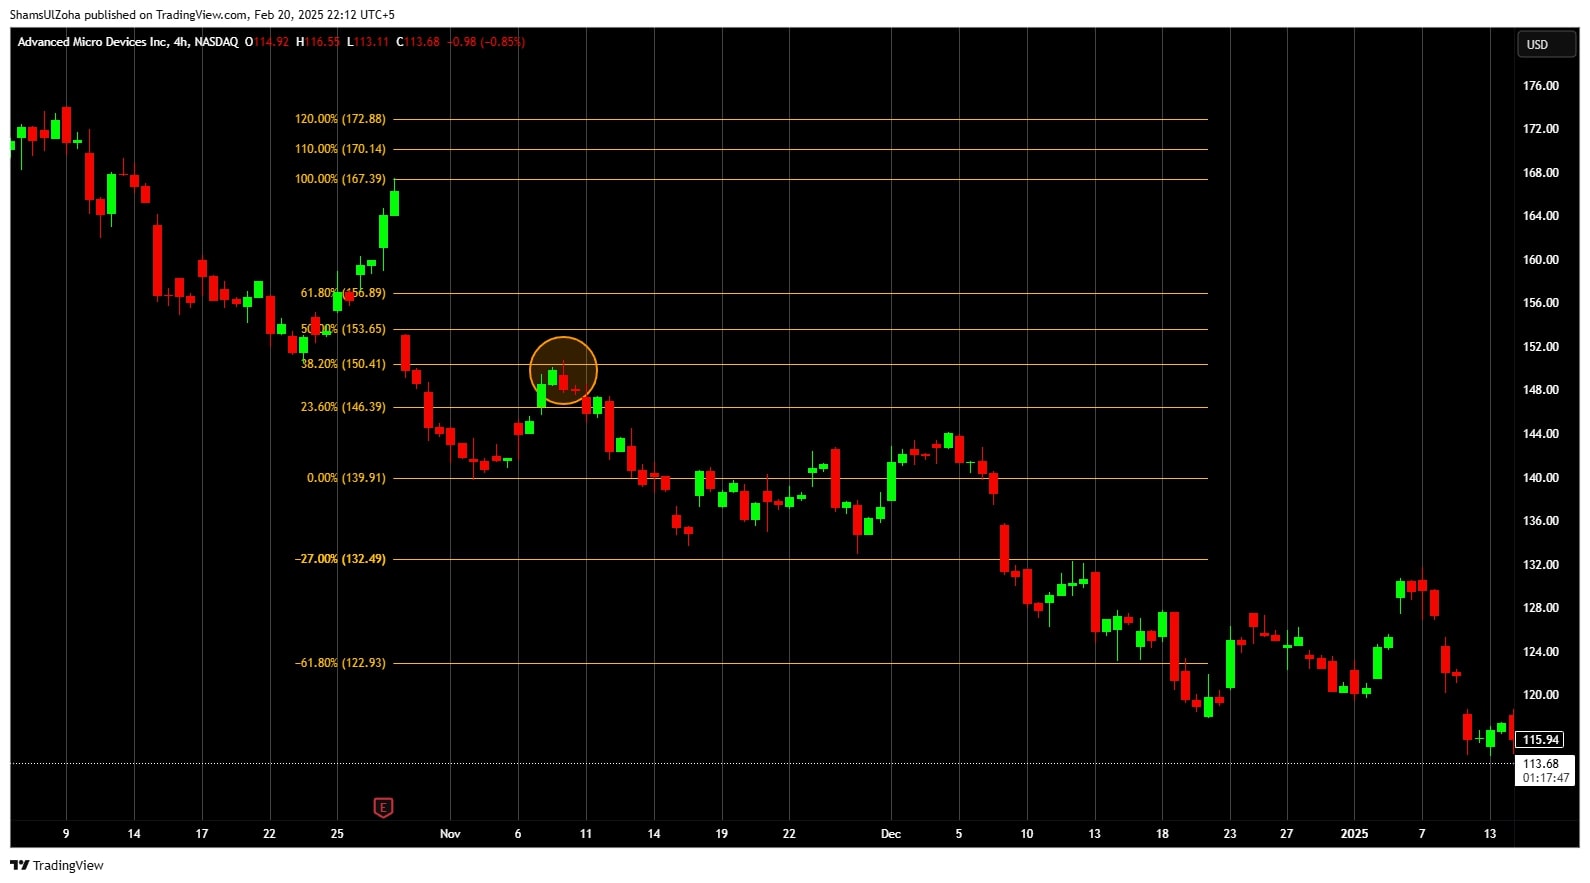
Advanced Micro Devices Inc. (NASDAQ: AMD) is in a downtrend in the figure above. A trader can use Fibonacci retracement levels to measure the amount of retracement in the stock. The market shows resistance at 38.2%. It forms a bearish candlestick pattern and then continues to move down.
Compared to other indicators like moving averages, Fibonacci retracements and extensions offer more precise levels to watch rather than just an average price over time.
Systematic Trading Perspective: Why Rules Matter?
For traders, applying Fibonacci retracements in trading systematically is a powerful tool that can yield better results than discretionary decision-making. When used in a trading system, Fibonacci retracements help traders avoid emotions or market noise.
The beauty of systematic trading is that it relies on calculated Fibonacci ratios and objective, data-driven rules. Traders use Fibonacci tools within these rules to backtest and verify their effectiveness, ensuring that retracement levels with other technical indicators align with real market behavior.
For example, a rules-based system might dictate buying when the price reaches the 38.2% retracement level and shows signs of a reversal, but only if the trend is still intact and the risk-to-reward ratio fits.

Traders can adjust the use of Fibonacci retracements according to their strategy.
Challenges of Using Fibonacci Retracements in a Trading System
One familiar pitfall traders face with Fibonacci retracements levels is over-reliance on these levels for trading decisions. While they are valuable, the market can often bypass these retracements and move in unexpected directions. Traders may also misuse Fibonacci retracements by constantly adjusting their entry points without thoroughly backtesting these changes.
To mitigate these challenges, combining Fibonacci retracement levels with other technical indicators, such as moving averages or the RSI, can help validate whether the price is likely to bounce at these levels. Additionally, adjusting Fibonacci settings and levels based on historical data through backtesting can enhance the tool’s effectiveness.
Actionable Tips for Using Fibonacci Retracements Effectively
Here are some tips traders can use to trade with Fibonacci retracement in trading effectively:
-
Combine Fibonacci levels with trend-following tools like moving averages to confirm the strength of a trend.
-
Wait for key Fibonacci retracement levels to align with price reversals or candlestick patterns (e.g., a bullish engulfing or doji) before entering a trade.
-
Apply Fibonacci analysis across different timeframes to identify areas of confluence where levels align on multiple charts.
-
Use Fibonacci retracements on a trading platform that allows customization and historical backtesting for better accuracy.

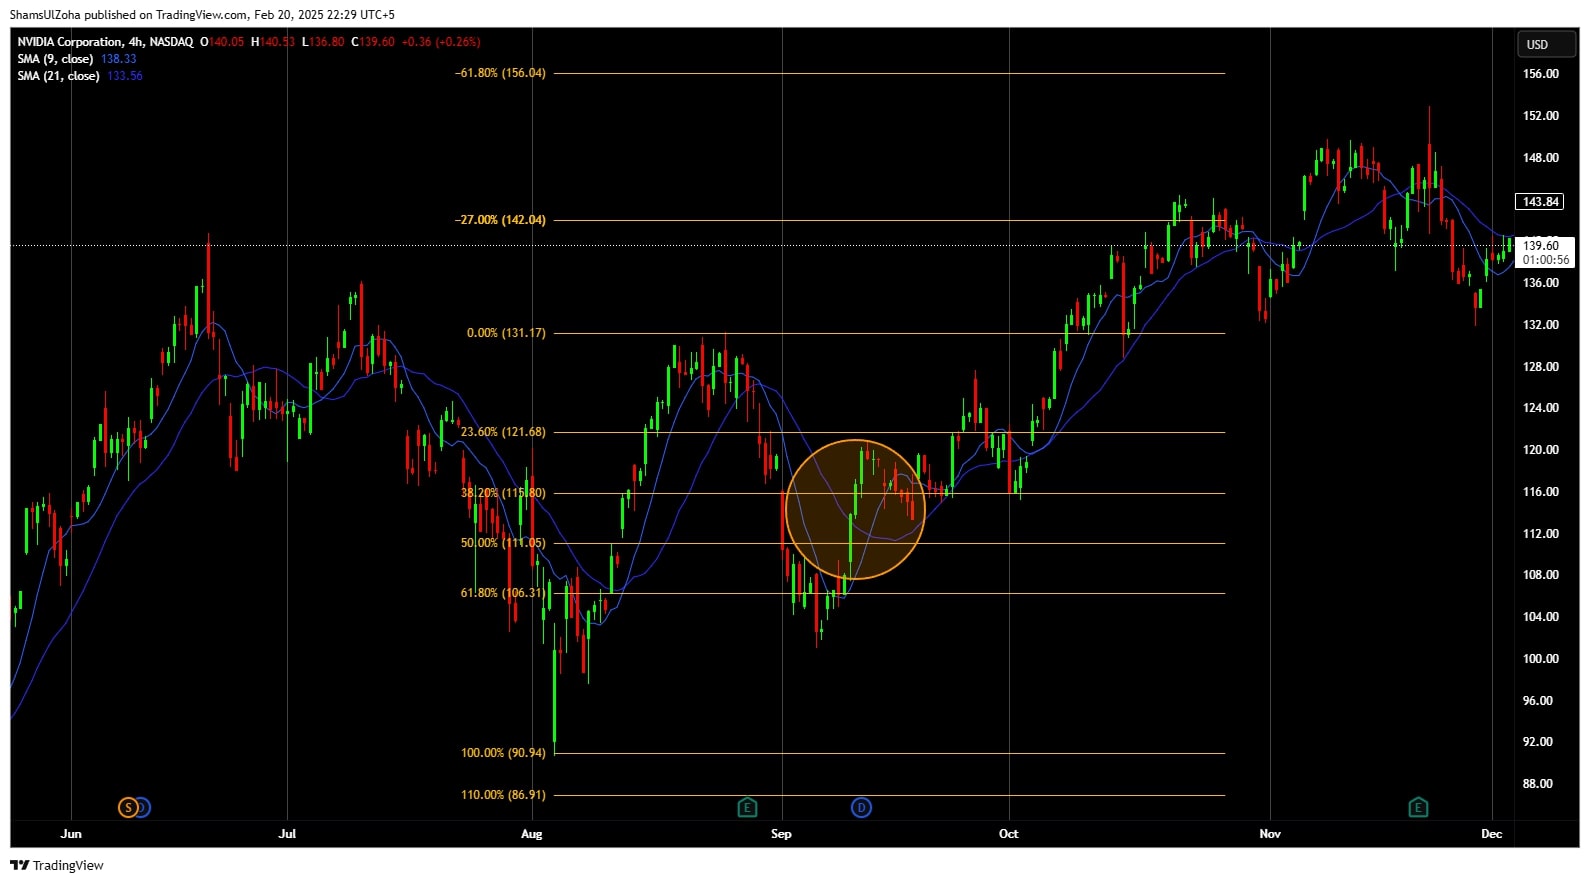
A solid example of using Fibonacci retracement with moving averages is on the H4 NVIDIA Corporation (NASDAQ: NVDA) chart. The trader uses the MA crossover coupled with 61.8% retracement on the price chart to place a long trade.
Fibonacci Vs Other Indicators
Fibonacci retracements are a powerful tool for stock traders, but they aren’t the only indicator out there. Let’s compare Fibonacci retracements with three other popular indicators: Moving Averages, Relative Strength Index (RSI), and Bollinger Bands.
1. Fibonacci Retracements vs. Moving Averages
- Fibonacci Retracements: Identify precise support and resistance levels (23.6%, 38.2%, etc.) during a price pullback within a trend.
- Moving Averages: Smooth price data over time but don’t indicate precise reversal points like key Fibonacci retracement levels.
- Key Difference: Fibonacci provides precise reversal levels while moving averages give a broader view of the trend.
2. Fibonacci Retracements vs. Relative Strength Index (RSI)
- Fibonacci Retracements: Focus on price levels where reversals might occur during a pullback.
- RSI: Measures market momentum, indicating overbought (above 70) or oversold (below 30) conditions, suggesting potential reversals.
- Key Difference: Fibonacci is about specific levels, while RSI shows market strength but doesn’t identify exact price levels.
3. Fibonacci Retracements vs. Bollinger Bands
- Fibonacci Retracements: Highlight key price levels for potential reversals during trends.
- Bollinger Bands: Indicate volatility ranges, with price extremes signaling potential reversals or continuations.
- Key Difference: Fibonacci focuses on price levels, while Bollinger Bands provides volatility insight, showing where prices may move outside normal ranges.
Common FAQs
What are Fibonacci Numbers?
Fibonacci numbers are a series of numbers in which each number is the sum of the two preceding ones, starting from 0 and 1. Mathematically, they can be written as:
- 0, 1, 1, 2, 3, 5, 8, 13, 21, 34, 55, …
The Fibonacci sequence starts with 0 and 1, and each subsequent number is the sum of the two previous ones. It can be expressed as:
- F(n) = F(n-1) + F(n-2), where F(0) = 0 and F(1) = 1.
What is the Fibonacci Sequence?
The Fibonacci sequence is a number series discovered by Leonardo Fibonacci. The Fibonacci sequence is the name given to the entire list of numbers produced by the Fibonacci pattern. As mentioned earlier, the sequence starts with 0 and 1, and each next number in the sequence is formed by adding the two previous numbers together. The sequence has fascinating mathematical properties and can be found in many natural occurrences, such as the arrangement of leaves, the branching of trees, the spiral patterns in shells, and even the structure of galaxies.
What is Fibonacci Retracement?
Fibonacci retracement levels are derived from the Fibonacci sequence to predict support and resistance levels in financial markets. The idea is that after a significant price movement, prices tend to retrace a predictable portion of that move before continuing in the original direction. The key Fibonacci retracement levels are:
- 23.6%
- 38.2%
- 50% (though not a Fibonacci number, it is commonly included)
- 61.8%
- 78.6%
Traders use these levels to identify potential areas where price may reverse, as the market often reacts at or near these Fibonacci retracement levels.
Conclusion & Next Steps
Incorporating Fibonacci retracement levels into a disciplined, rules-based trading strategy can enhance market decisions and reduce emotional trading errors. We should be cautious when using Fibonacci retracements in trading strategies because their levels are subjective and depend on how traders choose swing highs and lows, making them difficult to test consistently. Without clear, rule-based definitions that can be backtested and replicated in live trading, Fibonacci-based systems risk relying on hindsight bias rather than genuine statistical edge.
Remember that Fibonacci is best used alongside other tools. To master Fibonacci trading strategies and systematic trading, consider learning more about The Trader Success System.
If you’re ready to improve your trading today and avoid the pitfalls of discretionary decision-making, apply now to The Trader Success System. It’s designed to help you build trading strategies that are robust and proven to match your goals, lifestyle and risk tolerance.


