The Fisher Transform is a technical analysis trading indicator developed by John F. Ehlers, a renowned figure in technical analysis, designed to convert price data into a Gaussian normal distribution. In simple terms, this transformation makes it easier for traders to identify potential market reversals by transforming price movements into a more statistically meaningful distribution. By converting asset prices into a Gaussian-like curve, the indicator helps highlight peaks and troughs, making trading opportunities more apparent.
For systematic traders who rely on trading strategies based on objective signals, the Fisher Transform is a powerful tool. Since the indicator converts price fluctuations into a smoother pattern, it becomes easier to identify extreme overbought and oversold conditions, reducing market noise.
How the Fisher Transform Works?
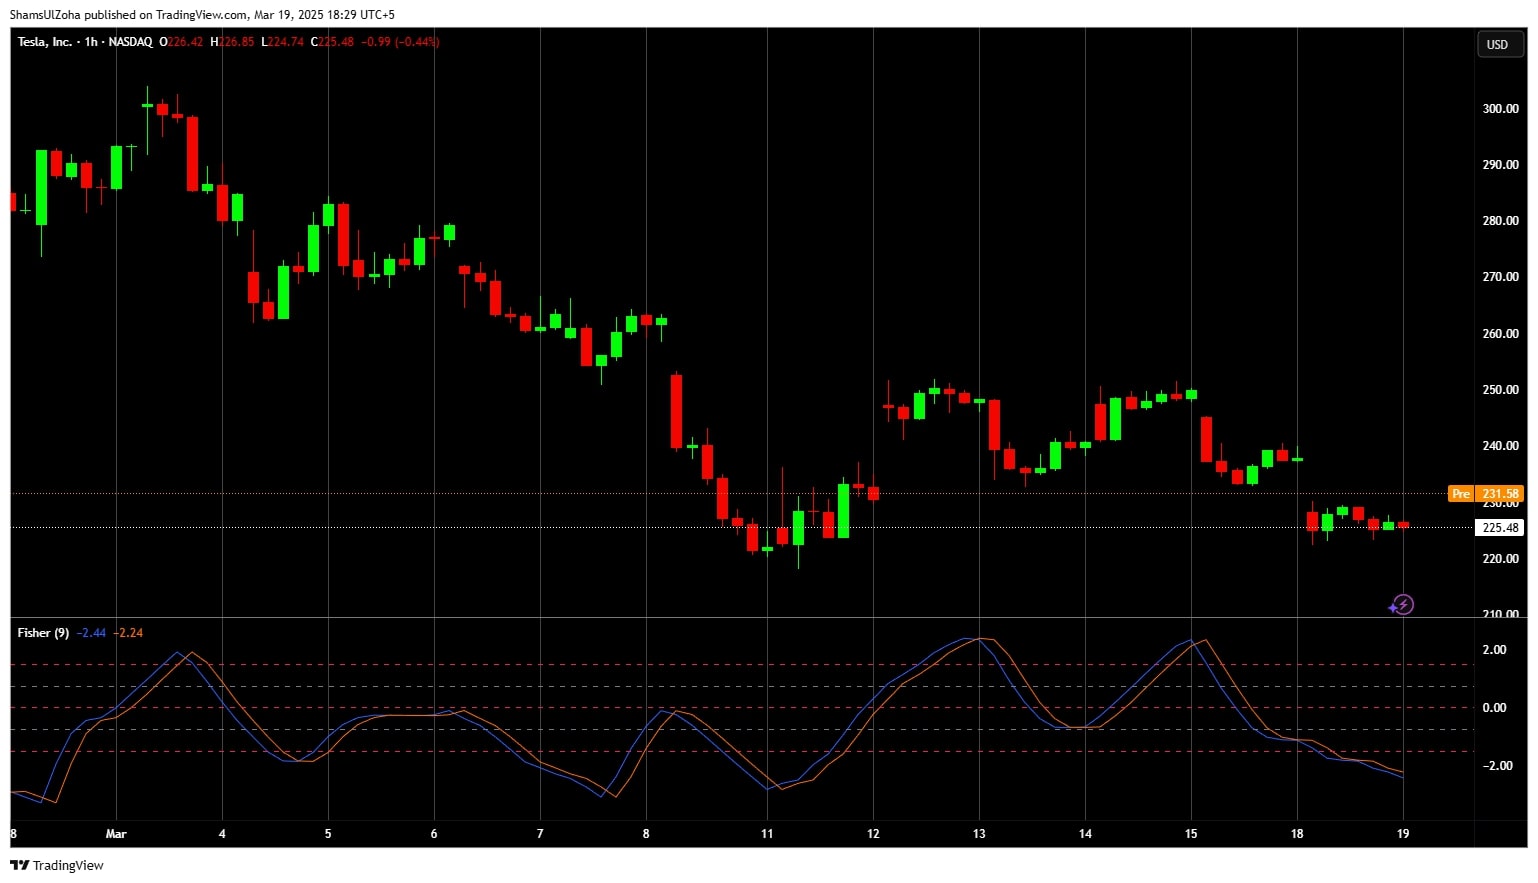
The Fisher Transform Indicator is based on a mathematical approach to normalize price data into a Gaussian normal distribution. Here’s how the process works:
1. Normalize the Price Data:
- First, you calculate the midpoint of the price data by finding the highest high and the lowest low over a specified lookback period.
- You then normalize the current price relative to this midpoint, creating a range of values between -1 and +1.
2. Apply the Fisher Transform Formula:
The core of the Fisher Transform is its mathematical formula, which is:

Here, X is the normalized price.
3. Smoothing the Fisher Transform Values:
The final step in the process is to smooth the transformed values, usually through a moving average (often a 9-period moving average). This helps to reduce the noise and make the trade signals more reliable.
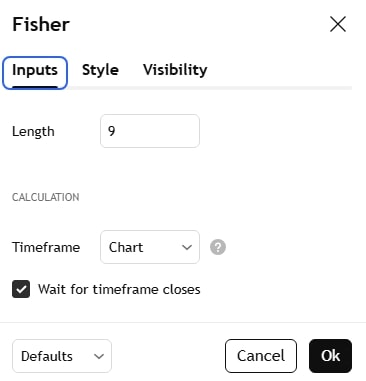
The default lookback period is typically set at 9 bars (days, hours, or minutes, depending on your timeframe), but it can be adjusted based on backtesting results.
Applications of the Fisher Transform Indicator in Systematic Trading
The Fisher Transform Indicator is a powerful technical indicator for identifying turning points, price reversal, and trend shifts. It serves several purposes in systematic technical analysis.
1. Identifying Potential Market Reversals
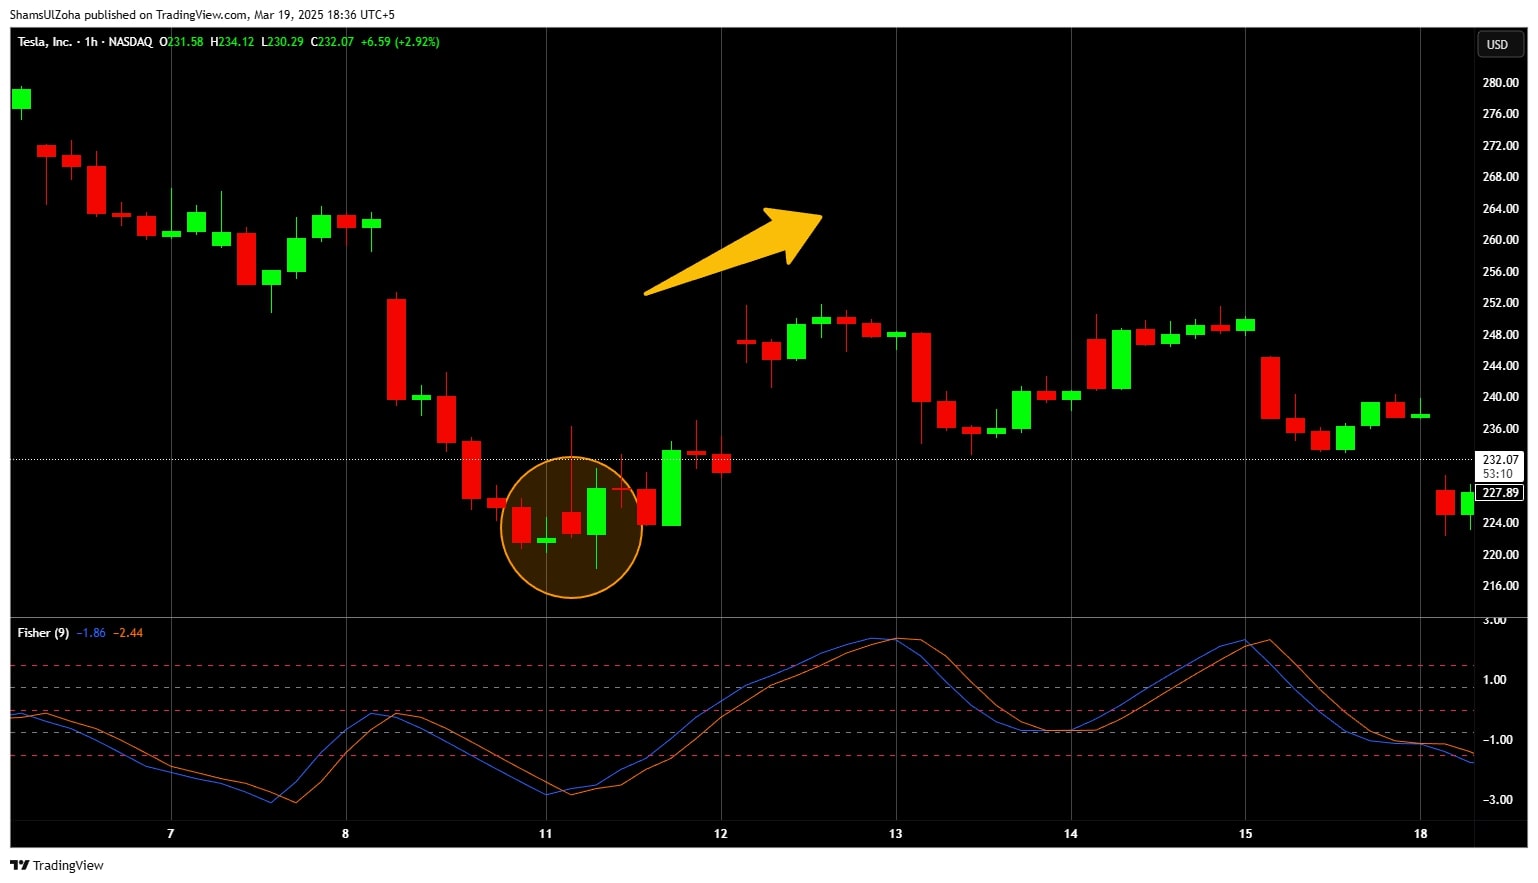
The Fisher Transform Indicator is particularly useful for identifying price reversal situations, where price movement is far away from the mean and could reverse. It signals when price movement is statistically significant and likely to change direction.
-
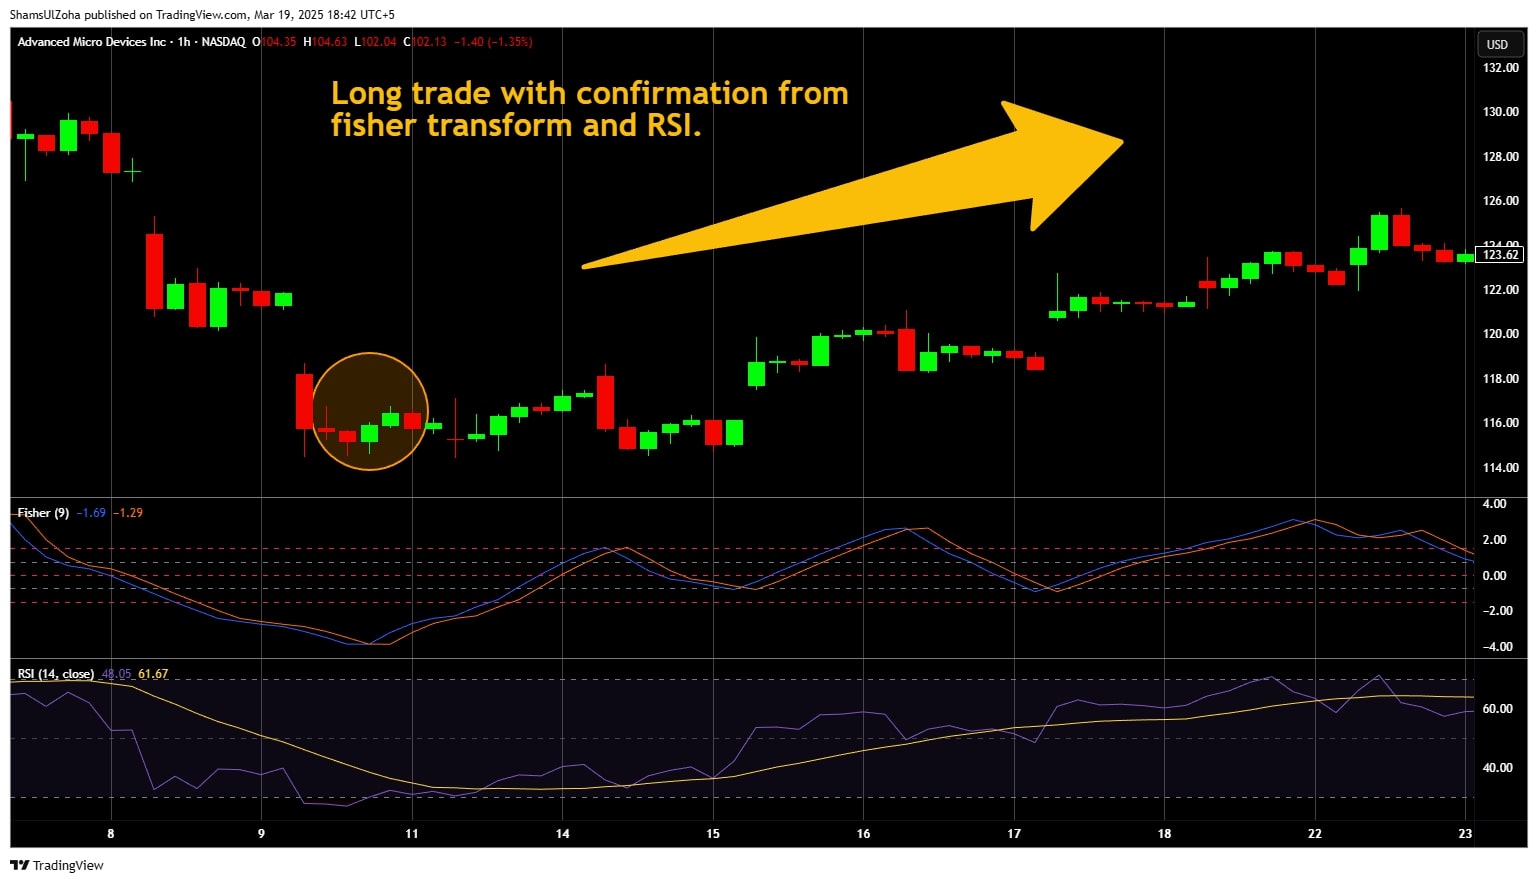
Bullish Signal: When the Fisher Transform Indicator crosses above its signal line (often a 9-period moving average) from a very low value (e.g., below -1.5), it indicates that the price data may have bottomed out, suggesting an opportunity to go long (buy).
-
Bearish Signal: When the Fisher Transform Indicator crosses below its signal line from a high value (e.g., above +1.5), it signals that the price data may be too high and could reverse, suggesting an opportunity to go short (sell).
2. Spotting Trends
The Fisher Transform Indicator also helps traders to understand the overall market condition:
-
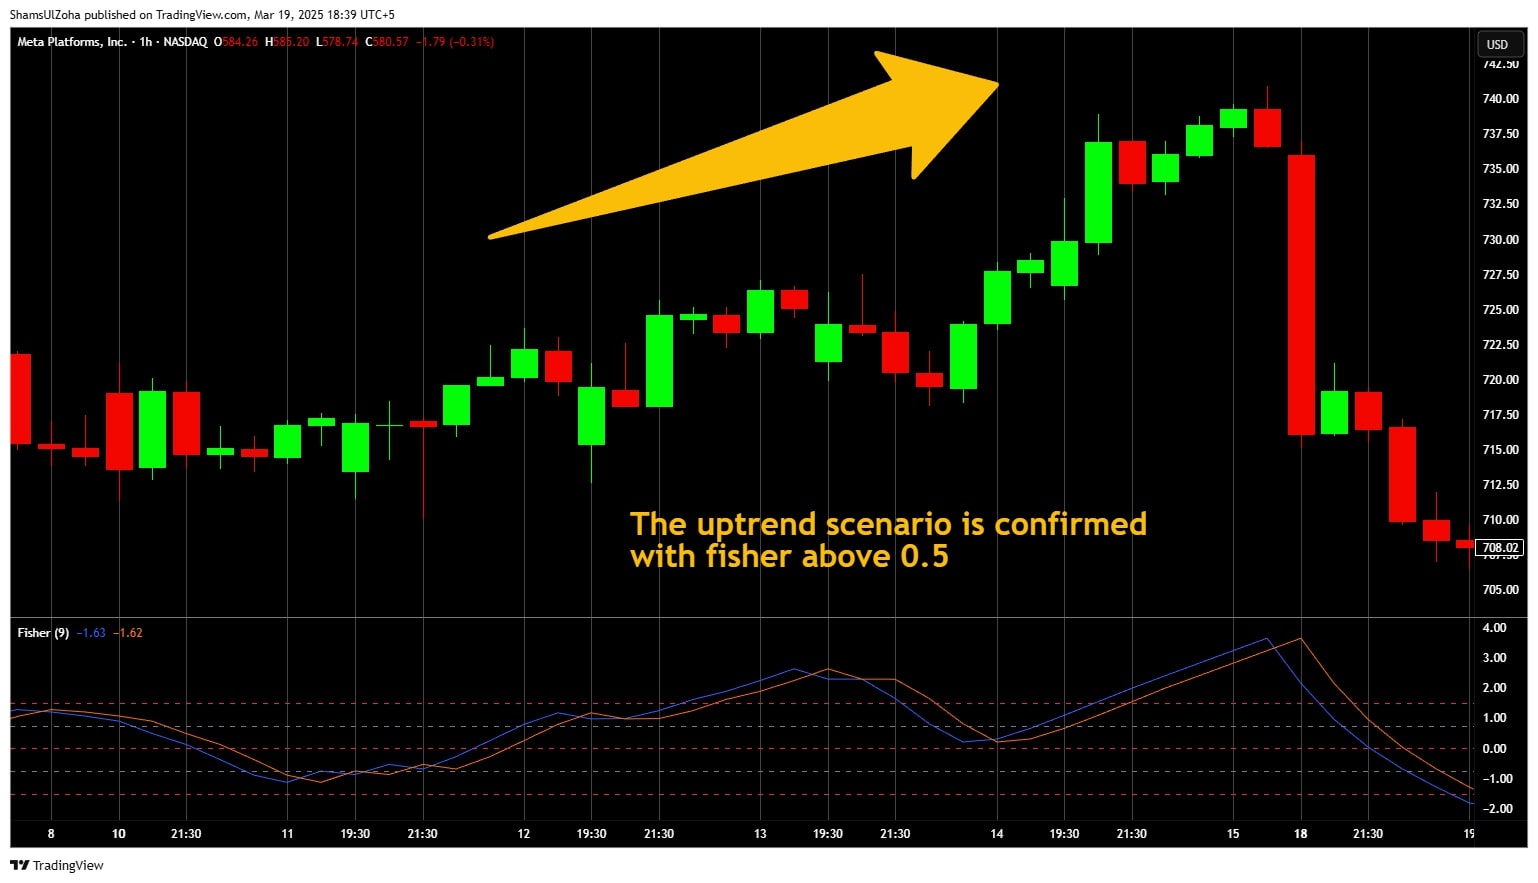
Above Zero Line: The market is in an uptrend.
-
Below Zero Line: The market is in a downtrend.
-
Near Zero Line: The market is likely in a consolidation phase or sideways movement, with no clear trend.
This trend-following aspect of the Fisher Transform Indicator allows traders to align their trades with the prevailing market condition, which can significantly increase the probability of success.
3. Reducing Price Noise
One of the most useful aspects of the Fisher Transform Indicator is its ability to filter out market noise. Many technical indicators suffer from too many false signals, especially in choppy or sideways markets. The Fisher Transform Indicator highlights significant price movement, enabling traders to concentrate solely on price data that statistically indicates a likely price reversal.
How to Combine the Fisher Transform with Other Indicators
The Fisher Transform Indicator can be incredibly effective when used in conjunction with other technical indicators. Since it relies on past price data, it can sometimes generate false trade signals during low volatility or sideways markets. To mitigate this, traders can use the Fisher Transform Indicator and other technical analysis tools.
1. Trend Filters
Using trend-following technical indicators like moving averages (e.g., 50-day moving average) alongside the Fisher Transform Indicator can help traders avoid entering trades against the market’s primary trend. For example, if the Fisher Transform Indicator signals a bullish crossover, but the price data is still below the 50-day moving average, the trader may decide to wait for confirmation before entering the trade.
2. Momentum Indicators
Combining the Fisher Transform Indicator with momentum technical indicators like MACD or the Relative Strength Index (RSI) can further validate trade signals, For instance:
-
When the RSI indicates an asset is overbought, and the Fisher Transform Indicator shows a bearish price reversal, this would be a strong signal to sell.
-
Conversely, the trader might buy when the RSI is in the oversold zone and the Fisher Transform Indicator signals a bullish crossover.
Systematic Strategy Using the Fisher Transform
Here’s a simple strategy that combines the Fisher Transform Indicator with trend-following principles:
Trading Rules:
- Buy Signal:
-
Fisher Transform Indicator crosses above its signal line from below -1.5.
-
The price data is above the 50-period moving average.
- Sell Signal:
-
Fisher Transform Indicator crosses below its signal line from above +1.5.
-
The price data is below the 50-period moving average.
Limitations of the Fisher Transform
While the Fisher Transform Indicator is a powerful technical indicator, it does have its limitations. It is not a magic bullet and works best in a comprehensive technical analysis strategy.
1. False Signals in Range-bound Markets
The Fisher Transform Indicator can often produce false trade signals in markets where price movement is moving sideways or in a range. This happens because the technical indicator can become more sensitive to minor price movement, leading to premature entries or exits.
2. The Lag Factor
Although the Fisher Transformation sharpens price data, it is still a lagging indicator. It reacts to price movements after they happen, so traders should expect a slight signal delay. This is particularly problematic in high-frequency markets where rapid price changes occur. To manage this, traders often rely on smaller timeframes or intraday charts for quicker reactions.
3. Optimization Requires Time
The Fisher Transform’s lookback period and smoothing techniques must be optimized for each asset. This requires time and backtesting to find the best settings for the trader’s goals. The challenge of finding the right parameters is where systematic trading can help, providing traders with the tools to backtest and optimize their strategy based on historical data.
Conclusion and Next Steps
The Fisher Transform offers clear insights into market turning points and trends. Its ability to identify extreme price movements in the market makes it an essential tool for traders looking to eliminate noise and focus on meaningful signals. However, it should be used in combination with other indicators and part of a well-rounded trading system.
For traders looking to systematize their trading approach and avoid emotional pitfalls, The Trader Success System can help you integrate the Fisher Transform effectively into your strategy. With comprehensive training on backtesting, risk management, and system development, you can develop a systematic approach that works across multiple markets and timeframes.


