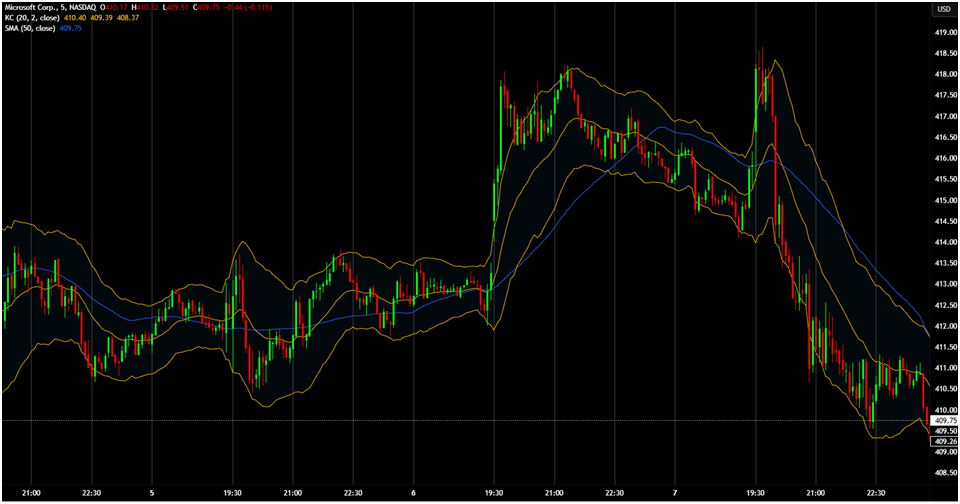
Keltner Channels are a volatility-based trading indicator that helps traders identify market trends and potential reversal points. The indicator consists of three separate lines: a middle line (Channel Middle Line) using an exponential moving average (EMA), and two outer bands above and below the moving average. The outer bands adjust based on the Average True Range (ATR), which measures market volatility and helps identify trends

A Real-World Analogy
Think of Keltner Channels like lane markers on a highway. The middle band is your driving lane, keeping you on track, while the upper channel and Channel Lower Band are like the road’s edges, showing when you’re veering too far in one direction. When price movements drift toward the outer bands, it can signal that the market is in a potential breakout phase, requiring an adjustment in strategy.
Why Keltner Channels Matter for Systematic Traders
Keltner Channels provides a clear, rule-based framework to identify potential price breakouts or reversals for systematic traders. They remove emotional guesswork from trading decisions, offering objective signals based on price trends and market conditions—perfect for traders who value consistency and precision.
How Keltner Channels Work in Trading
Keltner Channels are built using three key components:
- Middle Line: Typically a 20-period EMA, which smooths price bar data to show the direction of trends.
- Upper and Lower Bands: These are set a certain multiple of the 20-day Average True Range, above and below the EMA, often using a multiplier of 2.
This structure helps traders understand both channel distance and price strength.
Common Uses by Traders
Traders use Keltner Channels in several ways:
- Identifying Trends: When prices consistently touch or hover near the upper channel, it indicates a strong upward trend. The opposite is true when prices hover near the Channel Lower Band, signaling a downward trend.
- Spotting Breakouts: A channel breakout above the upper band suggests a bullish breakout, while a drop below the lower band signals a bearish breakout.
- Predicting Reversals: In trading ranges, traders might anticipate reversals with channel breakouts when prices touch the outer band.
Systematic Trading Perspective: Why Rules Matter
Emotions can easily derail even the most experienced traders. Fear, greed, and indecision can lead to bad trades. Keltner Channels helps eliminate this emotional bias by providing technical indicators that generate trading signals based on chart analysis indicator data.
Backtesting for a Competitive Edge
Before trusting any technical analysis indicator, testing it against historical data is essential. Breakout trading strategies using Keltner Channels should be backtested to assess performance under different market conditions.
Challenges of Using Keltner Channels in a Trading System
Despite their benefits, Keltner Channels come with limitations in the trading system:
- False signals in choppy markets: Keltner Channels work best in trending markets but can generate false breakouts in sideways conditions.
- Over-Optimization: Adjusting the default settings too much can lead to false signals.
Overcoming These Challenges
To improve accuracy, traders can combine Keltner Channels with momentum indicators such as the 10-period Commodity Channel Index or the Commodity Channel Index itself. This ensures that technical analysis is used effectively in trading-style decisions.
Keltner Channels vs. Other Indicators
Keltner Channels vs. Bollinger Bands
While both indicators use channel bands, they have key differences:
- Volatility Measurement: Bollinger Bands 0, 1, and 2 rely on standard deviation, whereas Keltner Channels use ATR.
- Best Use Cases: Keltner Channels suit trend-following strategies, while Bollinger Bands help with breakdown scenarios.

Keltner Channels vs. Moving Averages
- Trend Direction vs. Volatility Awareness: Moving Averages indicate trend direction, but Keltner Channels add dynamic resistance insights.
- Practical Application: Using a 20-day simple moving average with Keltner Channel Techniques improves technical analysis tool effectiveness.

A 50-period MA in blue is employed on the MSFT stock. The Keltner Channels are added to provide hints on the market volatility.
Keltner Channels vs. ATR
Keltner Channels visually represent future price movements using ATR, whereas ATR alone provides raw data for market flag analysis
Actionable Tips for Using Keltner Channels Effectively
Traders can apply Keltner Channels in different ways:
- Breakout Strategy: A close above the upper channel in financial markets signals a bullish breakout.
- Mean Reversion Strategy: Buying near the Channel Lower Band and selling near the upper channel optimizes day trade decisions.
- Trend Continuation with Pullbacks: A price crosses the middle band before continuing the trend-following strategies.
Best Market Conditions for Using Keltner Channels
Keltner Channels work best in trending markets and can be combined with additional confirmation tools, such as the Detrended Price Oscillator, for better trading style optimization.
However as mentioned above, in flat, low-volatility markets, Keltner Channels may generate false signals. Traders can combine them with other tools like volume indicators or trend strength measures to filter out noise and improve signal accuracy to prevent following false signals
Conclusion and Next Steps
Keltner Channels are a powerful technical analysis tool for trend-following strategies with price trend insights. If you’re looking to refine your investment strategy and make informed decisions, integrating Keltner Channels into your active stock market trading is a powerful approach.
If you’re ready to trade confidently and improve your profitability, The Trader Success System will guide you in building advanced trading systems for profitability in all market conditions. If you’re ready to improve your trading today and avoid the pitfalls of discretionary decision-making, apply now to The Trader Success System.


