The Moving Average Convergence Divergence indicator, or the MACD trading indicator is one of the most popular and effective technical analysis tools traders use. It can be used as a technical indicator to signify changes in a stock’s price trend’s strength, direction, and momentum. In this article, we’ll explore the ins and outs of using MACD effectively, its limitations, and how you can incorporate it into a systematic trading approach for greater consistency and profits.
What Is The MACD Indicator?
At its core, the MACD is a technical analysis tool for momentum trading that shows the relationship between two exponential moving averages (EMAs) of a stock’s price and its resistance levels. Developed in the late 1970s by Gerald Appel, the MACD indicator has become a technical analysis benchmark in financial markets analysis due to its simplicity and effectiveness in identifying bullish and bearish trends and momentum shifts.
The MACD essentially compares the short-term price movement with the long-term price movement. This helps traders assess whether the price chart is gaining or losing momentum. These momentum shifts can be a reliable signal of potential entry or exit points for traders. The tool also helps filter out market noise, giving a more objective perspective when making trading decisions.
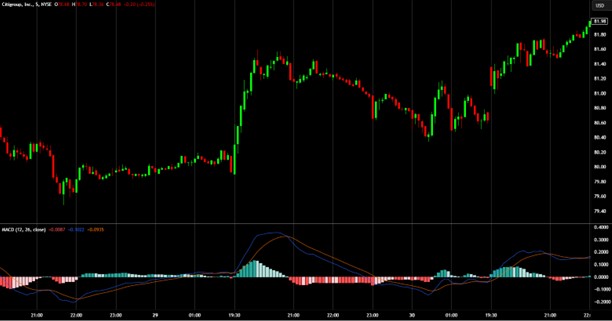
- On the chart below you can see the stock price in regular candlestick format at the top, and underneath you can see the MACD indicator. The blue line is the MACD line, the orange line is the signal line and the difference between these lines is shown as a histogram so it is easier to identify crossover points and divergences.
How Does MACD Work?
The three components of the MACD indicator are explained below:
- The MACD Line: This is the difference between two exponential moving averages—usually the 12-day EMA (fast line) and the 26-day EMA (slow line). The MACD line reflects the difference in momentum between the 12-day EMA and the 26-day EMA in moving averages.
- The Signal Line: This is a 9-day EMA of the MACD line itself. The signal line acts as a trigger for buy and sell signals for short-term EMA. When the MACD line crosses above the signal line, it can be interpreted as a buy signal, and when the MACD line crosses below the signal line, it could indicate a sell signal.
- The Histogram: The histogram shows the difference between the MACD line and the signal line. It is displayed as bars above or below the zero line, with positive technical indicators of bullish momentum and negative bars indicating bearish momentum.
How to Use MACD in Your Trading Strategy
MACD is used primarily for technical analysis, identifying bullish and bearish trends and momentum shifts in the financial market. It can also be a graphical representation of potential reversals based on these changes. Here are some of the key ways in which stock market traders use MACD.
1. MACD Crossovers
The most common use of the MACD is the MACD crossover, which occurs when the MACD line crosses the signal line (both the MACD line and the signal line are part of the MACD technical indicator).
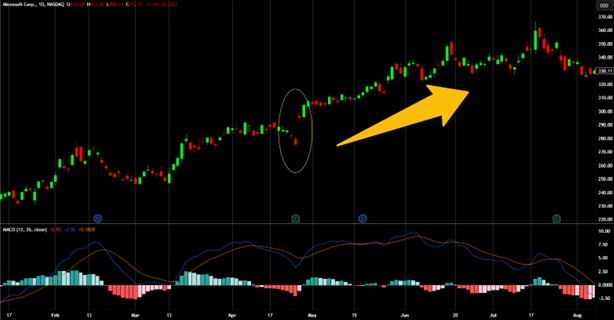
- Bullish Crossover: When the MACD line crosses above the signal line, this is considered a bullish signal. It suggests that the price chart is gaining upward momentum and may continue to rise. Traders interpret this as a technical indicator to enter a long (buy) position.
- Bearish Crossover: When the MACD line crosses below the signal line, it is a bearish signal. It suggests that the price is losing momentum, and there is potential for the price to fall. Traders may interpret this as a reliable signal to enter a short (sell) position or exit a long position.
Example: Suppose a stock is trending upwards, and you observe the MACD line crossing above the signal line on the chart. This signals a bullish trend direction, and the trader might enter a long position. Conversely, if the stock’s price starts to lose momentum and the MACD line crosses below the signal line, a trader might consider taking profits from long positions or selling short.
2. MACD Divergence
Divergence occurs when there is a discrepancy between the MACD and the asset’s price movement. Divergence can provide insight into potential trend direction and potential trend reversals in the stock market.
- Bullish Divergence: Bullish divergence happens when the price momentum of the asset is making lower lows, but the MACD is making higher lows. The technical indicator denotes that despite the stock price continuing to fall, momentum is shifting, suggesting a potential reversal to the upside.
- Bearish Divergence: Bearish divergence occurs when the stock price makes higher highs, but the MACD forms lower highs in the price charts. This suggests that momentum is weakening despite the negative values continuing to rise, which could be a reliable signal of an upcoming potential trend reversal or bearish trends to the downside.
Example: If a stock’s price makes new lows while the MACD forms higher lows, it suggests that downward momentum is weakening, and a potential trend reversal to the upside could be imminent. In this case, a trader might prepare to enter a long position in anticipation of the reversal.
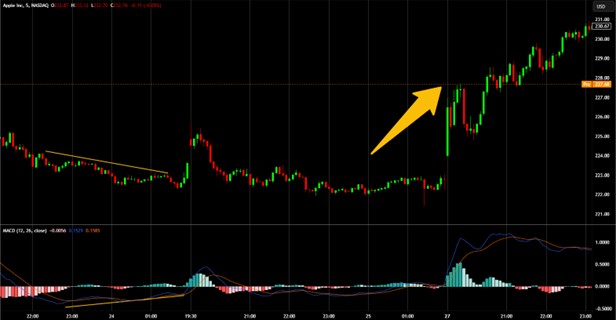
In the chart example above, Apple stock experienced a bullish divergence. As the price continued to make lower lows, the MACD indicator made higher lows. The stock shifted its direction soon after.
Divergences are notoriously difficult to code and so backtesting them can be difficult. They are one of the many signals in technical analysis that look extremely obvious in hindsight, but are difficult to recognize and act on in real time at the hard right edge of the chart. My recommendation is to only trade strategies that you can objectively code and backtest.
3. Rapid Rises or Falls in MACD
Another useful feature of MACD is identifying rapid rises or falls in the MACD line. When the MACD moves too far away from the signal line, it indicates that the stock may be overbought or oversold.
- Rapid Rise: When the MACD line rises sharply above the signal line, it suggests the stock is overbought. Traders may anticipate a price retracement or consolidation as the momentum slows down.
- Rapid Fall: When the MACD line falls sharply below the signal line, it indicates that the stock is in an oversold condition. Similar to a rapid rise, a retracement or a bounce back might be expected as momentum shifts.
To implement a strategy like this systematically, traders need their trading system to measure the distance between the MACD line and the Signal line and compare it to a threshold to generate the trading signal. the threshold distance would be selected through backtesting and optimization.
4. MACD Histogram
The MACD histogram is a visual representation of the difference between the MACD line and the signal line. A larger histogram suggests stronger momentum in the direction of the trend, while a smaller histogram indicates weakening momentum.
- Bullish Histogram: When the histogram is above the zero line, it confirms that the MACD line is above the signal line, indicating bullish momentum.
- Bearish Histogram: When the histogram is below the zero line, it confirms that the MACD line is below the signal line, indicating bearish momentum.
Example: Suppose you notice that the histogram is shrinking even though the MACD line is still above the signal line. This indicates that the bullish momentum is weakening, and you might want to consider exiting the position or waiting for further confirmation of a reversal.
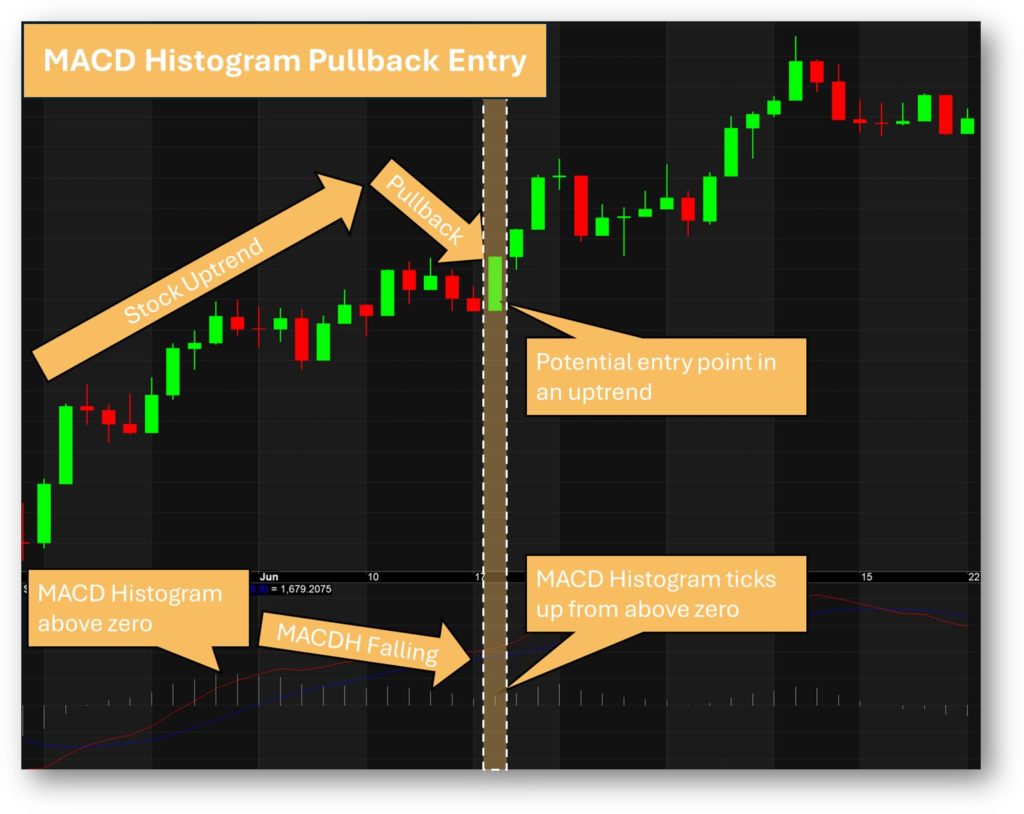
Changes in direction of the MACD Histogram can also be used as trading signals. For example, when the histogram is above zero but and trending down, then turns around and starts trending up, this can be a good potential entry point because the stock is trending up (MACD histogram is above zero), but had a pullback (the MACD Histogram was trending down), but the pullback is slowing and turning around (the MACD Histogram started trending back up). This entry concept is illustrated below:
MACD vs. Other Technical Indicators
While MACD is a powerful momentum indicator, it is essential to combine it with other technical tools to confirm signals and avoid false positives.
MACD vs. RSI (Relative Strength Index)
The Relative Strength Index (RSI) is another popular indicator that helps technical traders assess whether a stock is overbought or oversold. While the MACD focuses on momentum, RSI evaluates the magnitude of closing price changes over a given period. The two technical indicators can complement each other well.
- MACD shows the relationship between moving averages and can indicate potential trend shifts based on momentum.
- RSI provides an overbought or oversold condition, signaling whether the asset is likely to reverse soon.
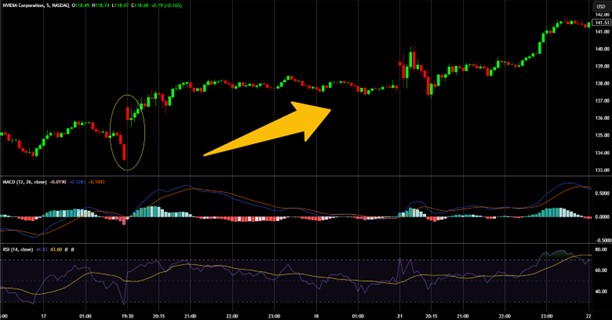
Technical traders often use both together to verify the strength of a trend. For instance, if the MACD signals a bullish crossover while the RSI is above 50, the buy signal is more likely to be valid.
MACD and RSI technical Indicators on the NVIDIA chart. The bullish crossover on the MACD indicator coupled with the RSI above 50 provided a good confluence on the long position.
What are the Light Gray Bars on a MACD Indicator?
The light gray bars on a MACD (Moving Average Convergence Divergence) technical indicator typically represent the MACD Histogram. MACD line, which is the difference between the 12-day EMA and 26-day EMA (exponential moving averages) and the Signal line (usually a 9-day EMA of the MACD).
Limitations of MACD
While MACD is a highly effective technical indicator, it does have certain limitations that traders must be aware of:
- Lagging Indicator: As with any moving average-based technical indicator, MACD is a lagging tool. This means it reacts to past price movements, which can result in delayed signals. Traders may miss out on the initial stages of a trend or might enter or exit a trade too late.
- False Signals: During periods of low volatility or when the market is consolidating, MACD can generate false positives or false signals, especially in sideways markets. To avoid this, traders often use ADX (Average Directional Index) to confirm whether a trend is truly in place.
Over-optimization: Many traders make the mistake of fine-tuning the MACD settings to fit historical data perfectly. This can result in poor performance in live trading, as over-optimization often leads to a strategy that works well in backtests but not in real-time trading.
Mitigating MACD’s Limitations
To mitigate the limitations of MACD, traders can combine it with other technical tools:
- ADX for Trend Confirmation: The ADX helps to measure the strength of a trend, whether it’s bullish or bearish. An ADX value above 25 suggests a strong trend is in place, making MACD signals more reliable.
- RSI for Overbought/Oversold Conditions: Combining MACD with RSI can help identify when a stock is overbought or oversold, which may help prevent entering trades when a reversal is imminent.
- Backtesting: Before applying any trading strategy involving MACD, it is essential to backtest it on historical data. Backtesting helps ensure the strategy is robust and can withstand different market conditions.
Actionable Tips for Using MACD Effectively
Here are some actionable tips to help you use MACD effectively in your trading strategy:
- Use MACD for Trend Following: A simple trend-following strategy could involve entering long positions when the MACD crosses above the signal line and exiting (or entering short) when it crosses below the signal line. Always consider the overall trend and use the MACD to confirm it.
- Look for Divergence: Watch for divergence between the MACD and the price chart. A bullish divergence occurs when the closing price makes lower lows, but the MACD forms higher lows, signaling a potential upward reversal. A bearish divergence occurs when the price makes higher highs, but the MACD forms lower highs, suggesting a potential downward reversal.
- Consider Market Conditions: MACD is most effective in trending markets. During sideways or choppy market conditions, the MACD might generate frequent false bullish signals and resistance levels, so be cautious and consider using additional filters like ADX to confirm trends.
- Combine MACD with Other Technical Indicators: To increase your confidence in your trades, use MACD in combination with other technical indicators like Bollinger Bands, RSI, or ADX. This helps filter out false signals and confirm that the trade aligns with the broader market conditions.
- Adjust MACD Settings Based on Market Volatility: In fast-moving markets, consider using shorter-term MACD settings (e.g., 5-day and 13-day EMAs), while in slower-moving markets, longer settings (e.g., 26-day EMAs and 52-day exponential moving averages) might provide smoother signals.
Backtest Your Strategy: Before committing real capital to a MACD-based strategy, backtest it with historical data and check resistance levels. This allows you to evaluate how the strategy would have performed in different market conditions and refine it for better results.
MACD Indicator Frequently Asked Questions
What Is MACD?
MACD (Moving Average Convergence Divergence) is a momentum-based technical indicator that helps traders identify trend direction, momentum shifts, and potential buy or sell signals. It is composed of the MACD line, signal line, and histogram to analyze price action.
How Do You Use the MACD Indicator?
Traders typically use MACD in several ways:
- MACD Crossovers: A bullish signal occurs when the MACD line crosses above the signal line, while a bearish signal occurs when it crosses below.
- Divergences: If the price makes new highs/lows but MACD does not, it may indicate a weakening trend and a potential reversal.
- Histogram Changes: The MACD histogram visually represents momentum—expanding bars suggest strengthening trends, while contracting bars indicate weakening momentum.
Which Is Better, MACD or RSI?
MACD and RSI serve different purposes:
- MACD focuses on momentum and trend-following.
- RSI (Relative Strength Index) measures overbought/oversold conditions. For best results, traders often combine MACD and RSI to confirm signals and avoid false trades.
Neither indicator is inherently better or worse and both can be incorporated into profitable trading systems.
What Does the MACD Line Tell You?
The MACD line represents the difference between two exponential moving averages (typically the 12-day and 26-day EMAs). When it moves above the zero line, it signals bullish momentum; below zero, it indicates bearish momentum.
What Is a Good MACD Signal?
Here are three good MACD signals:
- Bullish Signal: When the MACD line crosses above the signal line, ideally with a rising histogram.
- Bearish Signal: When the MACD line crosses below the signal line.
- Divergence Confirmation: A divergence between price action and MACD often hints at trend reversals.
All trading signals should be backtested to ensure they are profitable and consistent over time before using with real money.
What Is the Ideal MACD Setting?
The standard MACD settings are 12, 26, 9:
- 12-day EMA (fast)
- 26-day EMA (slow)
- 9-day EMA (signal line)
Traders can tweak settings based on market conditions (e.g., using 5, 13, 6 for short-term trading).
What Are the 3 Numbers in MACD?
The three numbers in MACD settings represent:
- Short-term EMA (default: 12)
- Long-term EMA (default: 26)
- Signal line EMA (default: 9)
What Is the Best Strategy for MACD Trading?
Thee of the best MACD trading strategies are:
- Trend Confirmation: Trade in the direction of a strong trend.
- MACD Crossover Strategy: Buy when MACD crosses above the signal line; sell when it crosses below.
- MACD Divergence Strategy: Identify reversals when price moves in the opposite direction of MACD.
How to Avoid MACD False Signals?
- Combine MACD with RSI: Ensure RSI confirms MACD signals.
- Use Trend Filters: Trade only in the dominant trend direction.
- Confirm with Volume: Rising volume adds credibility to MACD signals.
What Is the Best Combination with MACD Indicator?
- MACD + RSI: Confirms overbought/oversold conditions.
- MACD + ADX: Helps filter strong trends.
- MACD + Bollinger Bands: Identifies breakouts.
Is There a Better Indicator Than MACD?
MACD is powerful, but no single indicator is perfect. Some traders prefer Stochastic Oscillator for faster signals or Bollinger Bands for volatility-based strategies. In reality good trading systems can be created using a range of technical indicators, however, for momentum based systems and trend following systems the MACD is a solid choice.
Which Is More Accurate, RSI or MACD?
Accuracy depends on market conditions:
- MACD works better in trending markets.
- RSI is more useful in range-bound markets.
What Is the Disadvantage of MACD?
There are two main disadvantages of the MACD Indicator:
- Lagging Indicator: Since MACD is based on moving averages, it may provide signals late.
- False Signals in Sideways Markets: MACD generates many whipsaws in choppy markets.
Does MACD Really Work?
Yes, when used correctly and in combination with other indicators. MACD works best in trending markets and with proper risk management to filter out false signals.
Can MACD Be Used for Day Trading?
Yes, but traders often use shorter settings (e.g., 5, 13, 6) to make MACD more responsive to intraday price movements.
What Is the Difference Between MACD and Signal Line?
The MACD line shows the difference between two EMAs, while the signal line is a 9-day EMA of the MACD line to smooth out signals.
Does MACD Work for Crypto Trading?
Yes, MACD is widely used in crypto markets to detect momentum shifts and trend reversals.
Should I Use MACD in a Bear Market?
MACD works well in bear markets for identifying short-selling opportunities when the MACD line crosses below the signal line.
Conclusion and Next Steps
The Moving Average Convergence Divergence is a powerful tool for identifying trend changes, momentum shifts, and potential buy and sell signals in the market. It works by comparing short-term and long-term price movements and resistance levels, helping professional traders identify whether a stock is gaining or losing momentum. When used effectively, the MACD can enhance a trader’s ability to make objective, data-driven decisions, reducing reliance on emotions and improving consistency in trades.
At Enlightened Stock Trading, we believe that a solid, rules-based trading system is the key to achieving consistent profits. If you’re ready to stop guessing and start trading with confidence, we invite you to explore The Trader Success System. Our comprehensive program will guide you in mastering systematic trading and building a sustainable, profitable approach to the markets.
Remember – You are only one trading system away! To build a solid command over trading strategies, you can apply to the Trader Success System and improve your stock portfolio today.
Articles on Other Trading Indicators
To explore how different trading indicators can refine your strategy and boost your results, check out the links below. For a complete guide on using indicators effectively within a systematic approach, visit our Technical Indicators page.


