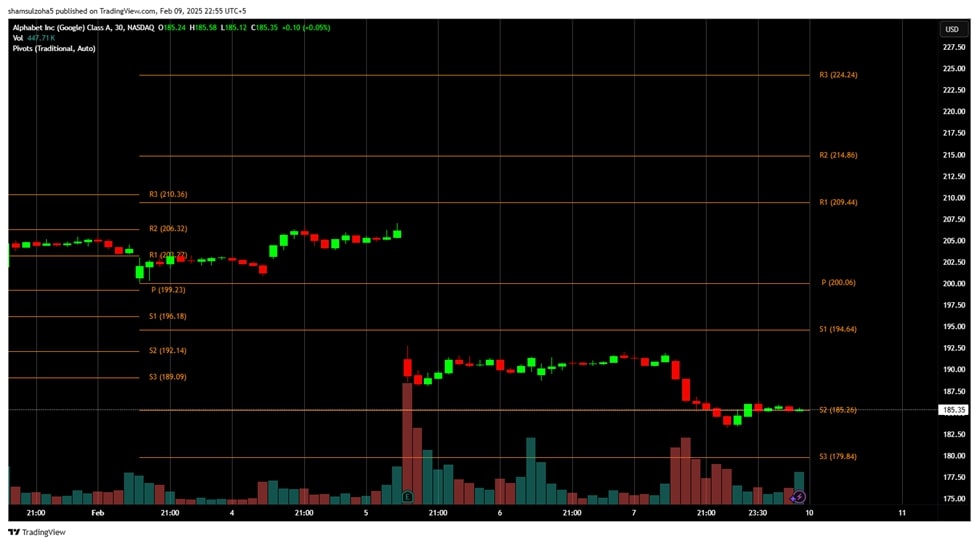
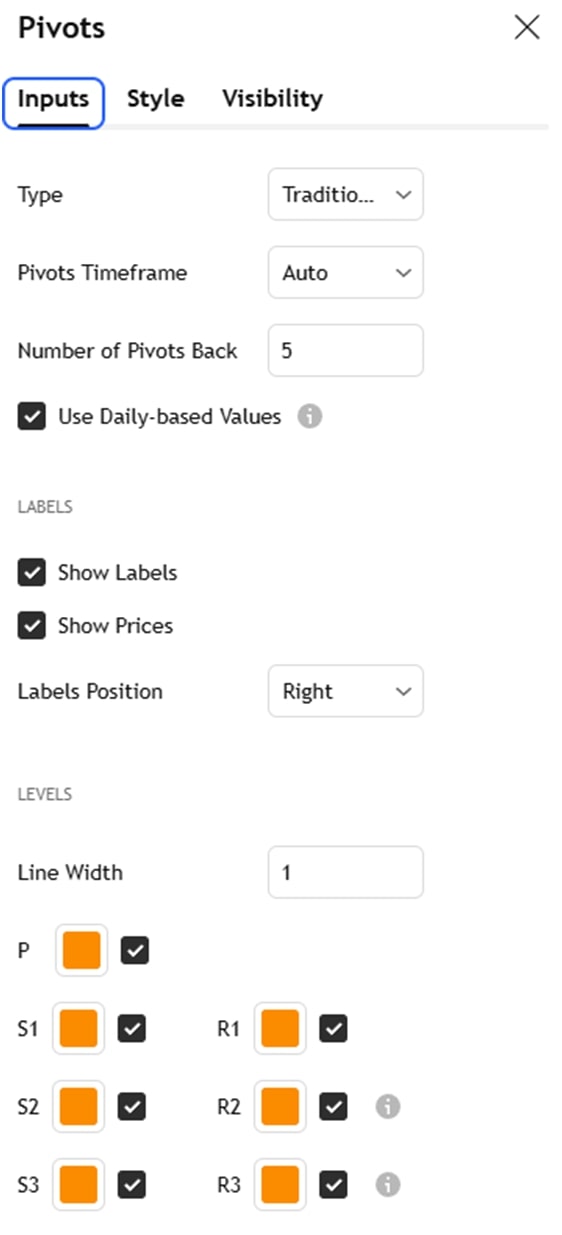
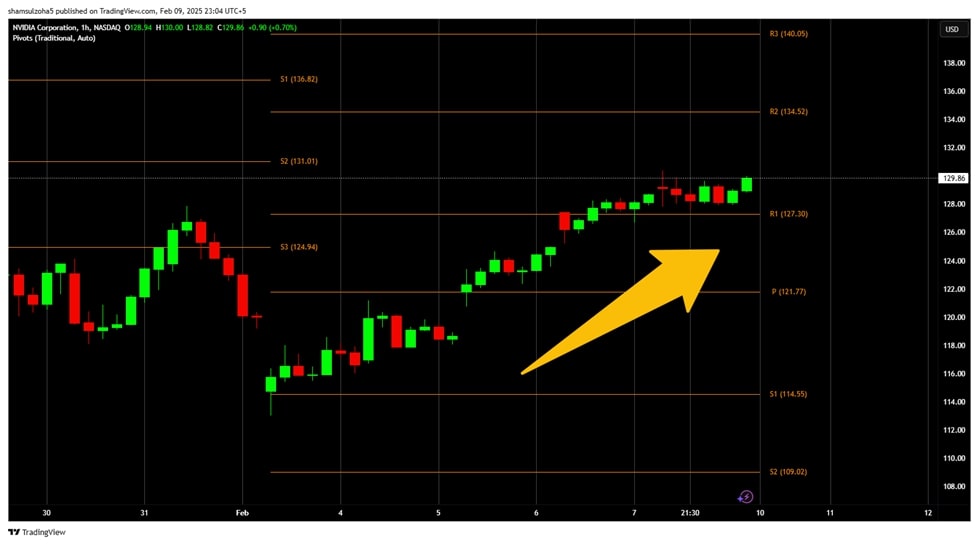
Pivot Points are one of a trader’s most reliable trading indicator tools. At their core, they are predetermined price levels on a price chart that signal potential areas of support and resistance levels. But instead of sounding like another technical indicator, think of Pivot Points as GPS markers for retail and floor traders. Imagine driving through a new city without a map—every intersection is a guess. Now, imagine having markers that tell you where major turns, speed bumps, or shortcuts are likely to appear. That’s what Pivot Points do for your trading strategies—they help navigate price action signals by identifying key levels where the market sentiment might turn.
For systematic traders, this is gold. Why? The pivot points indicator offers clear, objective trading signals that remove the need for emotional decision-making. Instead of wondering, “Is this stock going up or down?” you’ve got specific pivot levels that tell you, “If it breaks here, I buy; if it falls there, I sell.” It’s simple, structured, and perfectly aligned with rules-based trading strategies.

How Pivot Points Work in Trading
The mechanics of the Pivot Points indicator are straightforward, which is part of their appeal. They are calculated using the previous trading session’s daily pivot high, low, and closing price. Here’s how it breaks down:
- Pivot Point (P) = (Previous Period High + Previous Period Low + Closing Price) / 3
This is the central pivot, the primary level in price that traders watch.
From this central pivot, you calculate levels of resistance and support:
- R1 Resistance = (2 × Pivot) – Previous Low
- Support 1 (S1) = (2 × Pivot) – Previous High
- Resistance 2 (R2) = Pivot + (Previous High – Previous Low)
- Support 2 (S2) = Pivot – (Previous High – Previous Low)
- Resistance 3 (R3) = Previous High + 2(Pivot – Previous Low)
- Support 3 (S3) = Previous Low – 2(Previous High – Pivot)
These levels create a trading range or a roadmap for the current trading day.

How Traders Use Pivot Points
Here’s how day traders and swing trading techniques typically use Pivot Points in their trading strategies:
- Trend Direction Identification: If the current price trades above the Pivot Point, it signals bullish sentiment; if it is below, it indicates bearish sentiment.
- Potential Entry and Exit Points: If the price breaks above R1 resistance, breakout traders might enter a pivot point breakout trade, targeting additional levels like R2. Conversely, they might go short if the price drops below S1, aiming for S2.
- Stop-Loss Placement: Many traders place stop-loss orders just beyond these pivot levels to manage losses with pivot points.
Systematic Trading Perspective: Why Rules Matter
In trading, the biggest enemy isn’t the market trend—it’s you. Emotional decisions lead to inconsistent results. That’s where objective rules shine. With the Pivot Point indicator, you remove the guesswork. You’re not staring at a chart pattern, wondering if a stock looks “strong” or “weak.” You have specific price levels that dictate your actions.
This is where backtesting comes in. Running the historical data through your Pivot Point strategy, you can see its effectiveness over time. Does buying at R1 and selling at R2 work consistently? Does the price tend to bounce off S1 or break through it? Backtesting answers these questions before you risk real money.
Incorporating Pivot Points into a Rules-Based Strategy
You can follow specific, pre-defined rules to use Pivot Points’ predictive power while managing risk effectively. Here are two examples of incorporating them into your trading strategy:
• Rule Example 1: If the price opens above the Pivot Point and breaks R1 within the first hour, enter a long position with a stop-loss at the Pivot.
• Rule Example 2: If the price opens below the Pivot and breaks S1 after lunchtime, short the stock, targeting S2 for profit. Sticking to these rules eliminates emotional biases and bases your period trades on proven repeatable candlestick patterns.
Challenges of Using Pivot Points in a Trading System
While the Pivot Points trading approach is powerful, it’s not foolproof. Here are some common pitfalls traders face:
- Over-Reliance on a Single Indicator: Some traders rely solely on Pivot Points analysis, expecting them to predict every market direction. But financial markets are complex. Pivot Points are a guide, not a crystal ball.
- Ignoring Market Context: Pivot point levels work best in range-bound markets, where price reversals occur between critical levels. In a strong bullish trend or bearish trend, prices may break through pivot point levels and keep going, making them less reliable.
- Over-Optimization: Some traders tweak their calculation periods to fit past data perfectly—a classic case of curve fitting. The result? A strategy that looks great on paper but falls apart in a 24-hour market.
How to Mitigate These Challenges
While Pivot Points are a useful tool for identifying key price levels, relying on them alone can lead to inconsistent results, especially in volatile or trending markets. To get the most out of Pivot Points, it’s crucial to integrate them into a broader, more flexible trading strategy. Here are some practical ways to enhance their reliability and improve your trading outcomes:
- Combine with Other Indicators: Use Pivot Points alongside tools like moving averages or ADX to confirm trends and market strength.
- Adjust Based on Backtesting Results: As mentioned before, if backtesting shows that certain pivot levels don’t hold in volatile markets, adjust your strategy or avoid trading during those conditions.

Stay Flexible: Even in a systematic approach, recognize when market conditions invalidate your usual strategies and be ready to adapt.
Actionable Tips for Using Pivot Points Effectively
Ready to put Pivot Points to work? Here’s how to do it effectively in the stock market:
- Trade During High-Volume Periods: Pivot Points are most effective when markets are active. Focus on the first and last hours of the trading day when volatility peaks.
- Combine with Volume Indicators: If the price approaches a Pivot level with rising volume, it’s more likely to break through. Low volume near a pivot might signal a reversal.
- Use in Range-Bound Markets: Pivot Points shine when markets are moving sideways. In strong trending markets, use them cautiously or combine them with trend-following indicators.
- Pre-Set Your Orders: Pivot Points give you precise price levels, so you can pre-set limit orders to enter and exit trades automatically. This minimizes emotional interference and keeps your strategy disciplined.
- Avoid Overtrading: Not every pivot level is a trade signal. Be selective and only act when other indicators or market context support the move.
Pivot Points vs Other Indicators
How do Pivot Points compare to other technical analysis tools?
- Pivot Points vs Moving Averages (MA): Pivot Points provide static critical levels while Moving Averages adjust dynamically to current market conditions.
- Pivot Points vs Bollinger Bands: Pivot Points indicator sets fixed levels, whereas Bollinger Bands expand and contract based on market volatility.
- Pivot Points vs Fibonacci Retracement: Pivot Points use a traditional approach based on past prices, while Fibonacci retracement levels are based on percentage retracements of price swings.
Conclusion and Next Steps
Pivot Points are among the most powerful tools for traders seeking structure in their trading strategies. They provide static, predetermined pivot point levels that offer trading signals for potential support and resistance levels, making them invaluable for the forex market, stock market, and other financial instruments.
Ready to Trade with Confidence?
If you’re serious about taking the guesswork out of your trading strategies, it’s time to learn how to apply a Pivot Points trading approach systematically. The Trader Success System is designed to help traders like you master technical analysis, build confidence, and achieve consistent results across all trading platforms. Apply now the Trader Success System today!


