The Volume trading indicator measures the total number of shares traded for a specific stock over a time period. It tells you how much activity is behind a price move, offering valuable insight into market trends and market strength.
Think of trading volume like the crowd at a sporting event. If a team scores and the crowd erupts, it’s a big moment. But if the same team scores in an empty stadium, the impact feels less significant. A price breakout with heavy volume in trading is like that roaring crowd—it signals strong signals and conviction. That same breakout might not be as reliable without an increase in volume.
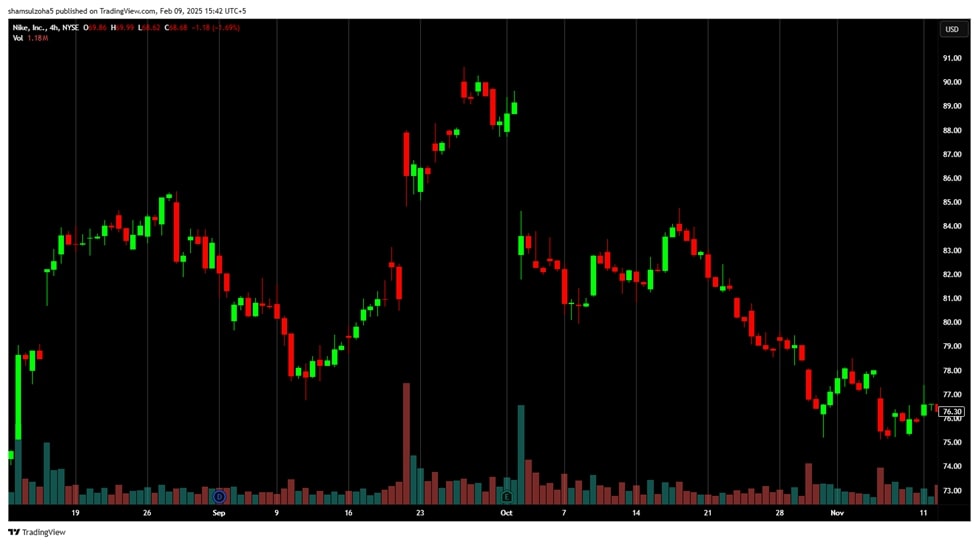
For day traders and professional traders, volume isn’t just noise—it’s a tool for objectively confirming price trends. It helps eliminate guesswork in decisions, making it ideal for those who prefer trading based on rules rather than emotions
How the Volume Indicator Works in Trading
The Volume Indicator adds up the number of shares traded during a specific trading session—whether that’s a minute, an hour, or a day. Volume dynamics are displayed on most charts as vertical bars at the bottom. A taller volume bar means more shares traded, while a shorter one indicates less activity.
Traders use volume-based indicators to confirm breakout levels, spot potential trend reversals, and analyze negative divergences. For instance, when the price level of a stock breaks above resistance levels, a spike in trading volume suggests the breakout is strong. On the other hand, if the typical price is climbing but daily volume is falling, it may indicate the current trend is losing momentum.
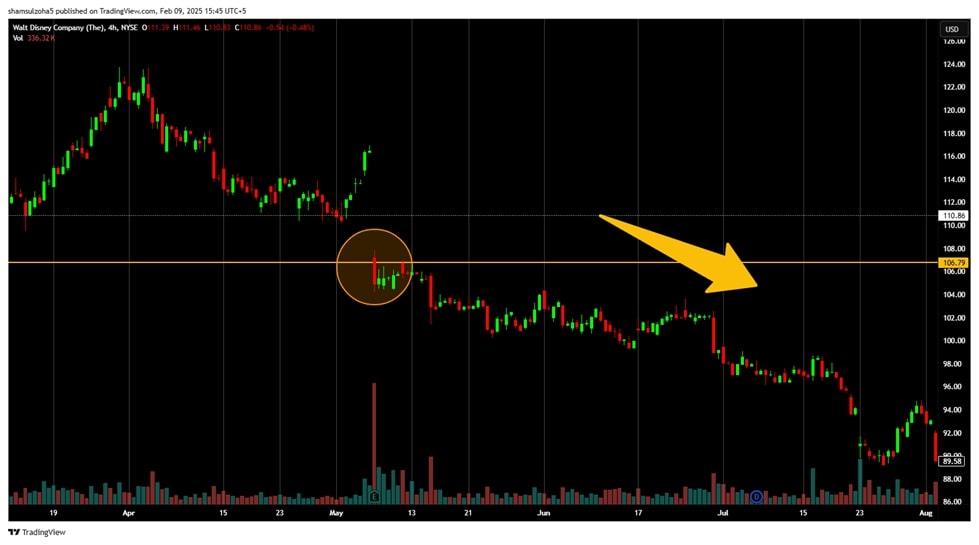
While volume analysis measures raw activity in a particular time frame, popular volume indicators like On-Balance-Volume (OBV) and Volume Weighted Average Price (VWAP) provide additional layers of interpretation. OBV tracks cumulative volume to predict future price movements, while VWAP calculates a fair price based on trading volume and price action. However, volume in relation to other factors remains one of the simplest and most effective technical indicators in trading.
Systematic Trading Perspective: Why Rules Matter
Interpreting the volume indicator values without clear rules can lead to inconsistent results. One day, you might see an abnormal volume spike and jump in, only to get burned because the move lacked follow-through. You might ignore a similar setup the next day and miss a profitable trade.
Objective rules eliminate this uncertainty. You remove emotional guesswork from your trading strategy by defining exactly how and when to act on volume signals. For example, a rule could be: Enter a trade only when the price crosses above resistance levels with daily trading volumes at least 50% higher than the 5-day exponential moving average of volume.
But how do you know if that rule works in a particular time period? Backtesting helps. Running your volume-based indicators through historical data shows whether they would have been profitable in the past. This process builds confidence and ensures your strategy has a real edge
Challenges of Using the Volume Indicator in a Trading System
While trading volume is powerful, it’s not foolproof. Here are some common pitfalls:
- Misreading Low Volume
Traders often assume that a decrease in volume means a weak move. But in quiet markets (like during holidays or pre-earnings periods), thinner volume might reflect less participation, not necessarily a lack of conviction. - Over-Optimizing Volume Settings
It’s tempting to tweak your technical analysis tools endlessly to get “perfect” backtest results. But this can lead to false signals, where your system performs excellently in the past, but fails in real markets. - Ignoring Context
Volume doesn’t exist in a vacuum. A sharp move in market sentiment during regular trading hours differs from one during after-hours trading—context matters.
Mitigating These Challenges
Here is how traders can mitigate the challenges associated with using volume-based indicators:
- Combine Volume with Other Indicators: For better confirmation, use volume in relation to trend technical indicators like moving averages or chart patterns.
- Backtest Realistically: Instead of chasing perfect results, create investment strategies that perform well across different market conditions.
- Adjust Based on Market Conditions: Recognize that volume patterns might differ between bullish divergence and bearish volume trends. Flexibility within your trading style is key.
Volume vs. Other Indicators: Why It Stands Out
In stock trading, there’s no shortage of indicators to choose from—moving averages, RSI, MACD, Bollinger Bands, etc. However, volume holds a unique position because, unlike most indicators that are derived from price, volume reflects actual market activity. It tells you how many shares are being traded, offering a direct insight into the level of interest behind a price move.
Volume vs. Moving Averages
Moving averages are great for smoothing out price data to identify trends over time. They tell you where the price is headed but not how strong that move is. A stock might be trending upwards, but without volume confirmation, that trend could be weak and prone to reversal. Volume adds context, showing whether traders are genuinely backing the move or if it’s just drifting on low participation.
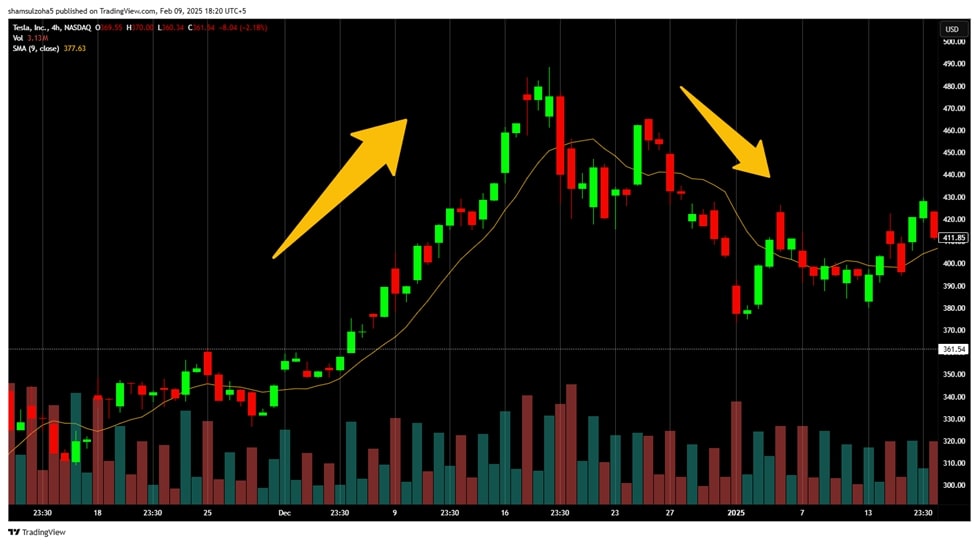
Volume vs. RSI (Relative Strength Index)
The RSI measures how overbought or oversold a stock is, helping traders spot potential reversals. However, RSI can often signal a stock is overbought while it continues to climb—or oversold while it keeps dropping. Volume can help validate these signals. For example, if RSI shows overbought conditions but volume keeps increasing, it might suggest the rally still has legs. Conversely, a pullback could be imminent if RSI signals overbought and volume starts to fade.
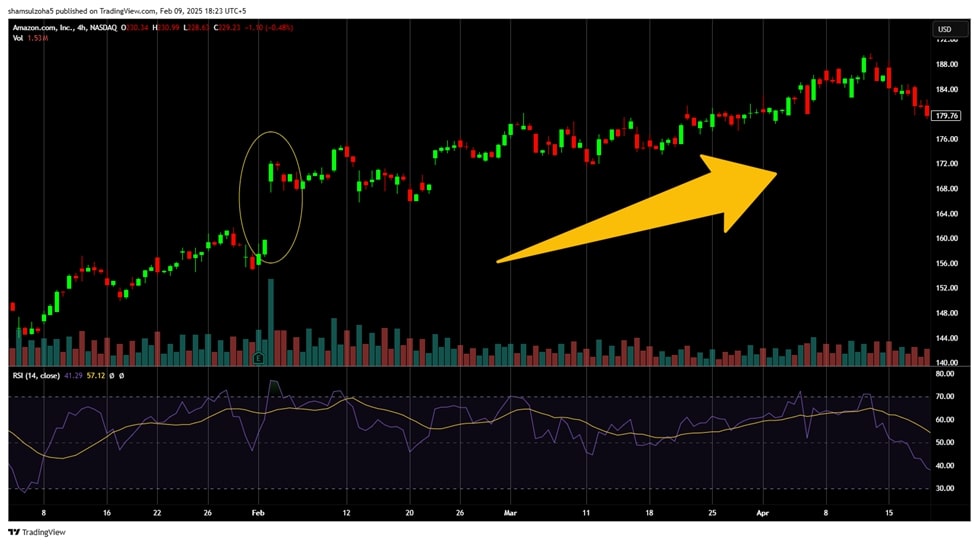
Volume vs. MACD (Moving Average Convergence Divergence)
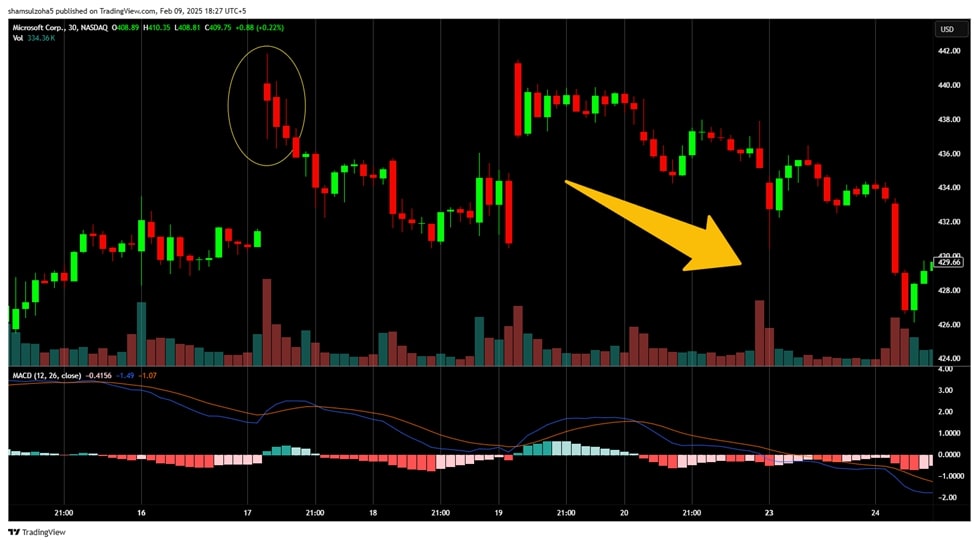
MACD is popular for identifying momentum and potential reversals based on moving averages. However, like most price-based indicators, MACD lags behind actual price movements. Volume, however, can give you real-time feedback. A sudden surge in volume might signal a shift in momentum before the MACD crossover even occurs, giving you an earlier edge.
Volume vs. Bollinger Bands
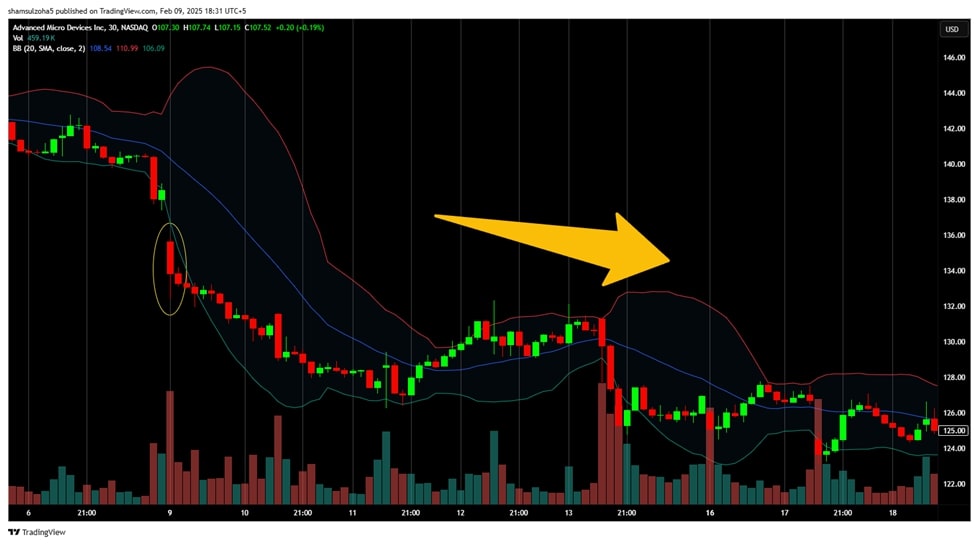
Bollinger Bands measure volatility by plotting price bands around a moving average. Prices moving outside these bands often signal a potential breakout or reversal. But without volume, it’s tough to tell if these breakouts are genuine or just temporary spikes. A price break above the upper Bollinger Band accompanied by a substantial volume is a more reliable signal than one with a weak volume.
How Does Trading Volume in the US Stock Market Compare to Forex?
The biggest difference is how volume is tracked and interpreted in each market. In the US stock market, volume is straightforward—it represents the total number of shares traded for a particular stock during a specific time period.
Stock exchanges like the NYSE and NASDAQ centralize and report this data, giving traders a clear and reliable picture of how much activity is happening behind price movements.
Take NVIDIA (NVDA), for example. Its trading volume has been so high in recent years, reflecting massive investor interest. On some days, tens of millions of shares are traded, signaling popularity and strong conviction behind its price movements. This transparent, high-volume data allows traders to confirm breakouts and trends confidently.
In contrast, the forex market operates differently because it’s decentralized. There’s no single exchange that tracks all trades. Instead, forex volume is typically measured by tick volume—the number of price changes during a given period. While tick volume is often a good proxy for actual trading activity, it doesn’t provide the same level of precision or transparency as stock market volume data.
Actionable Tips for Using the Volume Indicator Effectively
Volume analysis works best when integrated into a comprehensive investment strategy. One effective method is the Volume Breakout approach. Enter trades when a stock breaks above breakout levels with volume significantly higher than the average. This method works well in strong trends.
Another approach is using volume to spot potential reversals. After a prolonged downtrend continuation, a sudden increase in volume combined with price stabilization can indicate buyers stepping in. This setup often trading signals a potential price reversal.
Finally, watch for negative divergences. If a stock is making higher highs but trading volume is decreasing over a period of time, it could suggest weakening momentum. This insight helps identify potential downward reversals in overextended markets.
Conclusion and Next Steps
The Volume Indicator offers more than just a measure of ongoing trading activity—it provides a window into market sentiment. Understanding how to interpret and apply volume indicator values enhances your trading edge, helping you make informed decisions.
However, volume patterns are most effective in a systematic trading approach. Relying on gut feelings or discretionary calls leads to inconsistent results. Backtesting your strategies and adhering to objective rules builds consistency and confidence in your trading.
If you’re ready to eliminate the guesswork and harness the full power of technical analysis tools, explore The Trader Success System. It’s designed to help traders like you develop profitable, rules-based systems that withstand the test of time.


