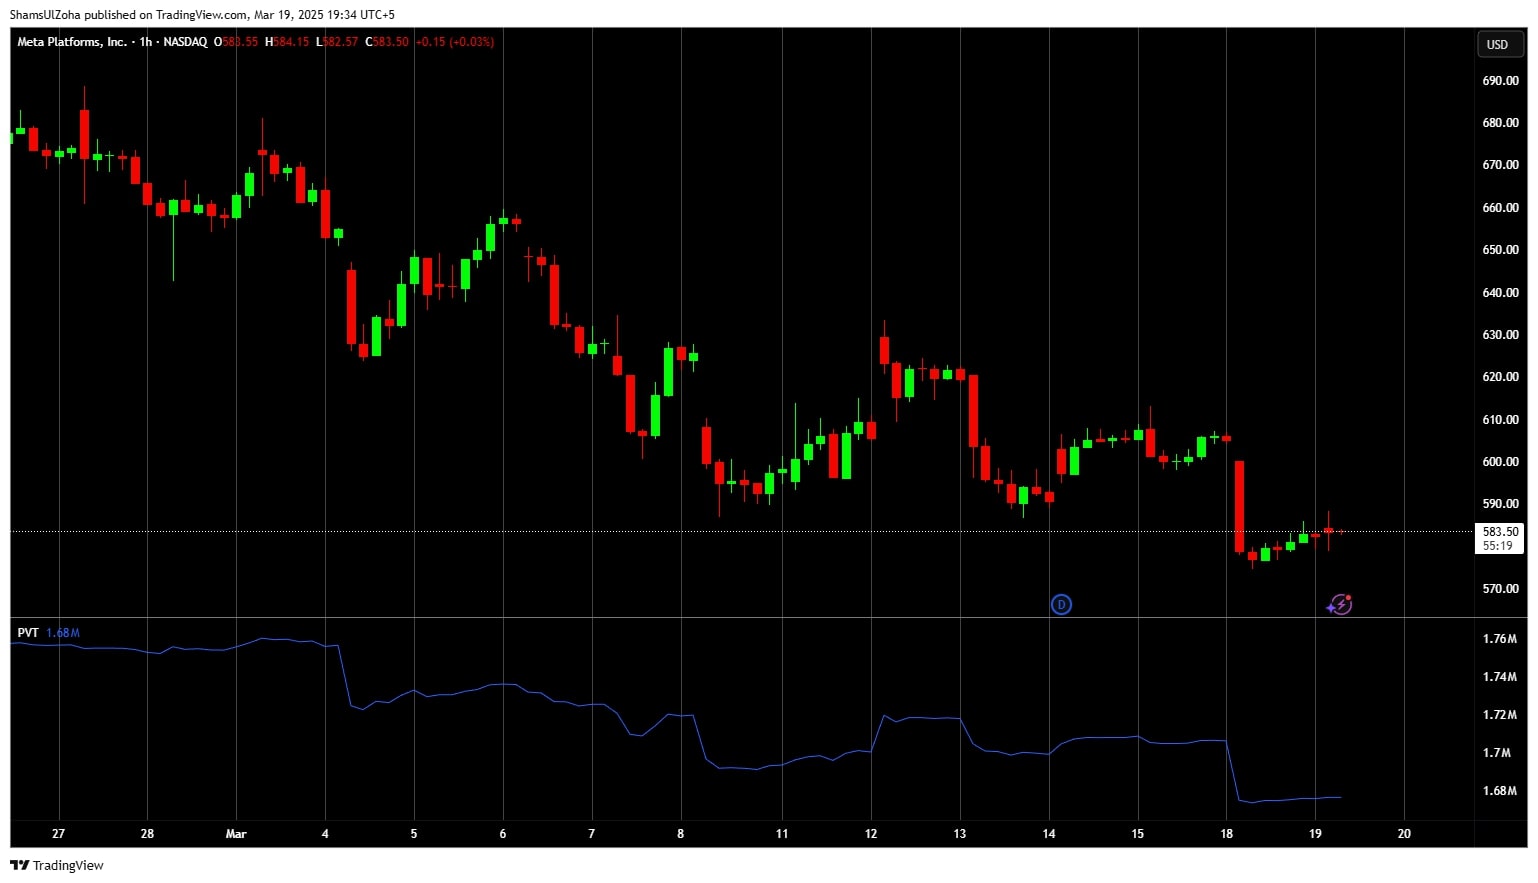
The Price Volume Trend trading indicator (PVT) is a technical analysis tool that combines price movement and trading volume to assess market sentiment. It functions similarly to the On Balance Volume (OBV) indicator but differs in adding or subtracting only a portion of the daily volume, adjusted for price changes.
This momentum indicator is primarily used to confirm trends and identify potential trend reversals, making it a valuable part of a systematic trading strategy.
Think of PVT like a heartbeat monitor for a stock—by tracking volume and price movements together, traders can assess the strength of a trend. When the PVT line rises, it suggests strong buying interest, while a falling PVT indicates increasing selling pressure.

How the Price Volume Trend Indicator (PVT) Works in Trading
The Price and Volume Trend indicator is calculated using the following formula:
- Percentage Change in Price – The formula first determines the percentage change in price between the current and previous day.
- Multiplying by Volume – This percentage change is multiplied by the daily volume, adjusting the total volume based on price movement.
- Cumulative Total – The result is added to the previous PVT value, forming a cumulative volume line over time.
Since the indicator is similar to the On Balance Volume (OBV) but adjusts based on price trend, it provides a more dynamic measure of money flow and the strength of price movements.
Trend Identification
The Price and Volume Trend indicator helps traders determine whether price increases or price declines are supported by sufficient trading volume:
-
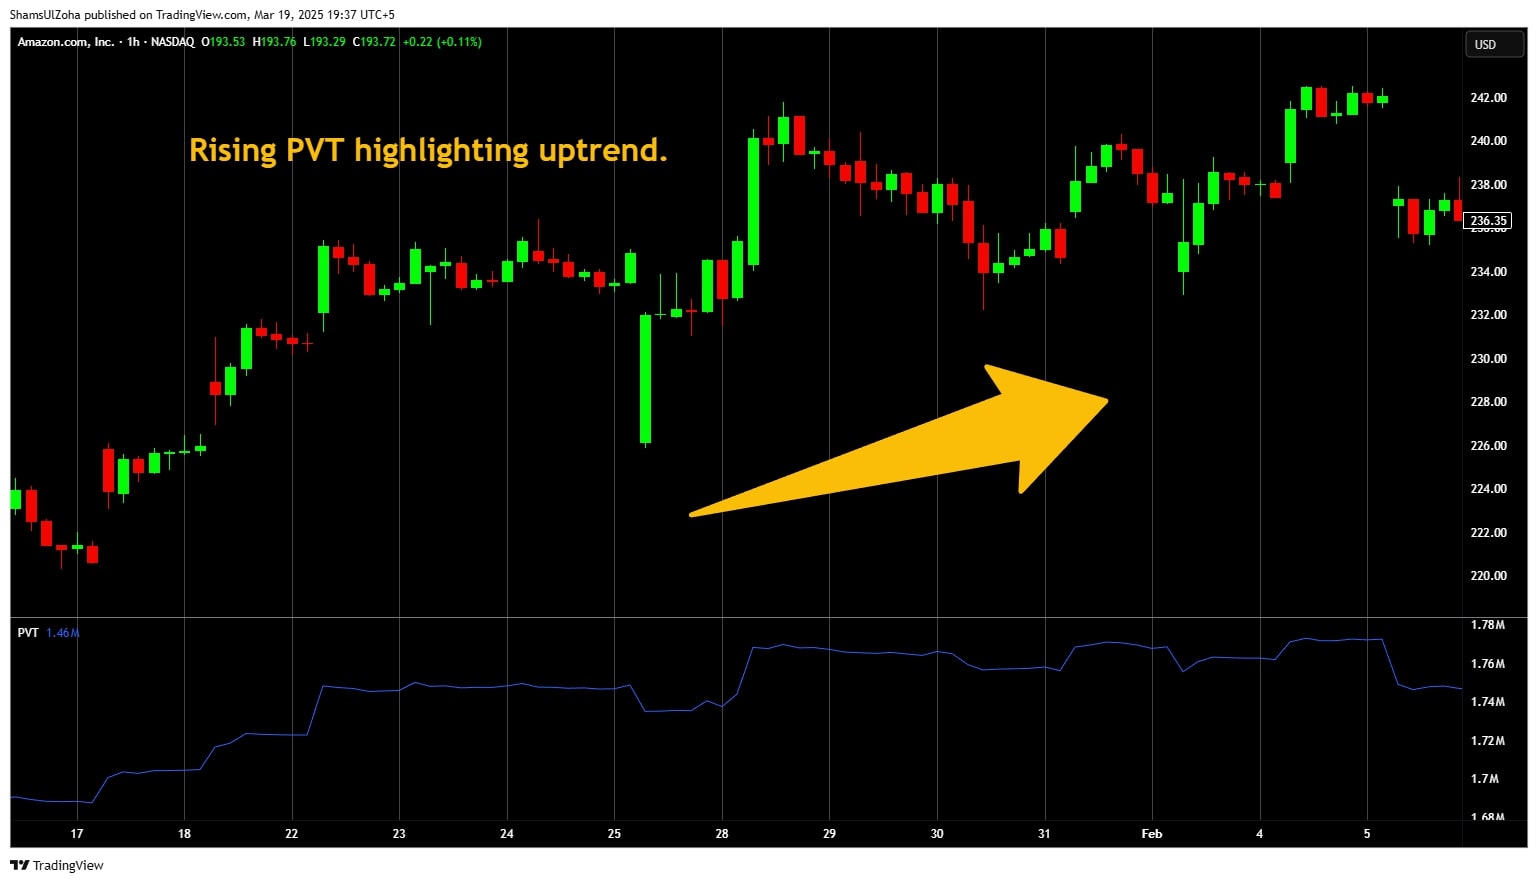
A rising PVT signals strong bullish momentum, indicating that price increases are backed by buying pressure.
-
A falling PVT suggests bearish momentum, meaning that price declines are driven by increased selling activity.
Since volume often leads price, traders use PVT to interpret price and volume trends and anticipate future price movements.

Divergence
One of the most powerful features of the PVT indicator is its ability to detect technical divergence, which can signal potential trend reversals:
-
Bullish Divergence – When the price makes a lower high, but the PVT rises, it suggests increasing buying pressure despite the security’s price decline.
-
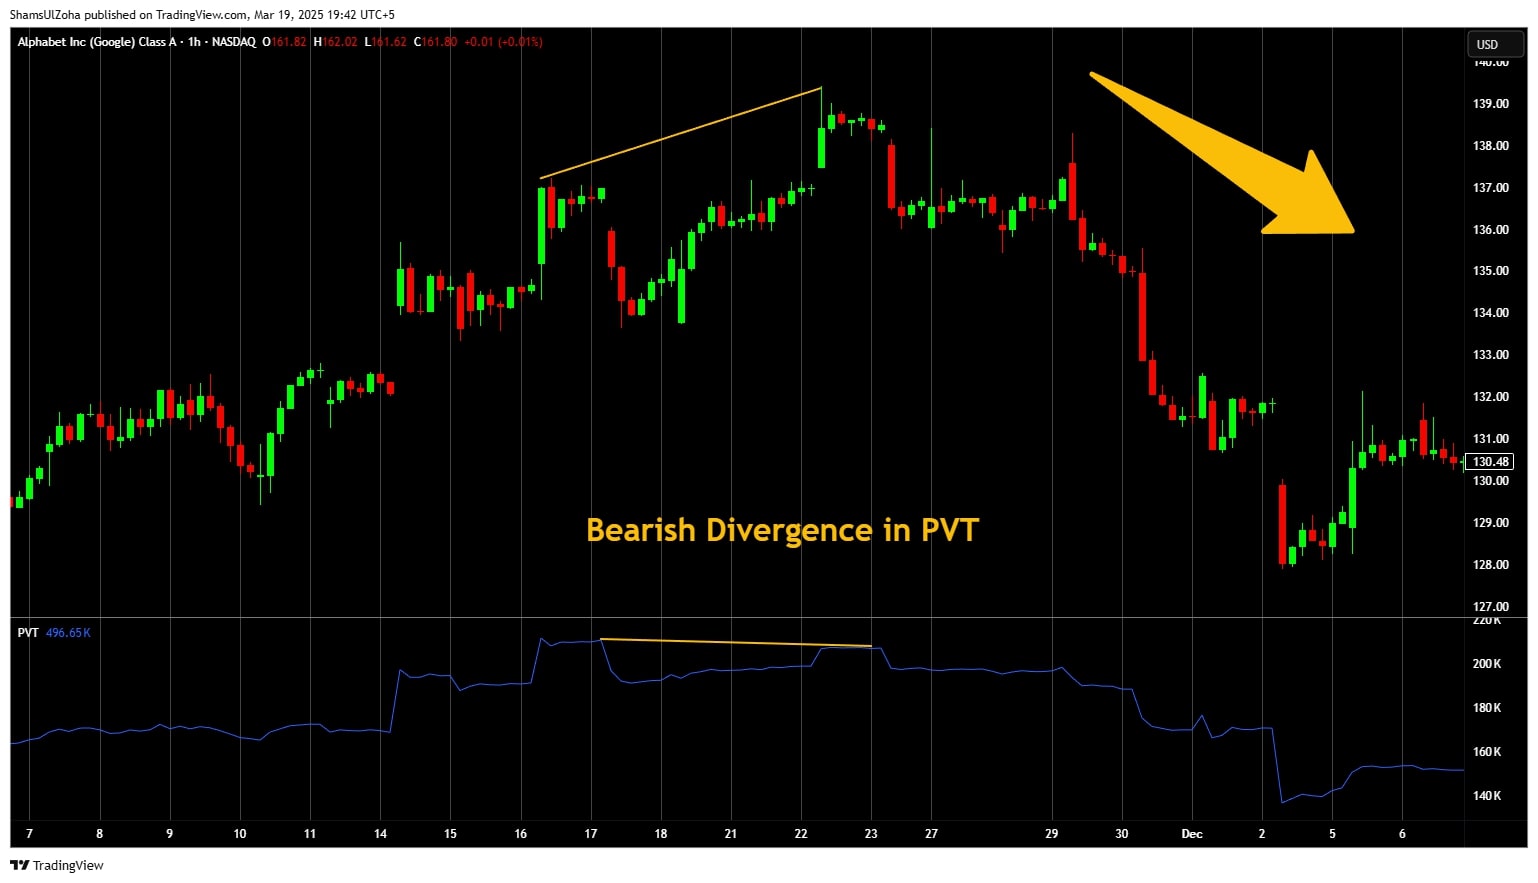
Bearish Divergence – When the price makes a higher high, but the PVT falls, it indicates weakening buying strength, making the upward price move unsustainable.
Traders watch for these divergences to generate trading signals, and anticipate market reversals before they happen.

Systematic Trading Perspective: Why Rules Matter
For systematic traders, the PVT indicator is valuable because it provides objective, rules-based signals rather than relying on discretionary interpretation. Key benefits include:
-
Confirming the Strength of a Trend – The PVT line helps validate whether a current trend has strong volume-based support.
-
Using the Indicator for Backtesting – Traders can test PVT-based trading strategies over a variety of historical market conditions to test the robustness of there rules.
-
Filtering False Signals – By combining PVT with moving averages, traders can smooth out noise and focus on high-probability setups.
Challenges of Using PVT in a Trading System
While the Price and Volume Trend indicator is a powerful technical analysis tool, it comes with some limitations:
- Lagging Indicator – Since PVT is based on past price changes, it may react slowly in highly volatile market conditions.
- False Signals in Sideways Price Action – The PVT indicator may produce unreliable signals in range-bound markets due to fluctuating volume data.
- Over-Optimization – Adjusting PVT settings excessively can lead to curve fitting, reducing effectiveness in live trading.
Here is how stock traders can mitigate these challenges:
- Combine with Other Indicators: Pair PVT with trend-following indicators (like moving averages) and momentum indicators (like RSI) to filter out noise.
- Monitor Divergences: Focus on divergences between price and PVT, which can provide early warnings of trend reversals.
- Use Multiple Timeframes: Analyze the PVT on multiple timeframes to validate signals and ensure a consistent trend.
Actionable Tips for Using PVT Effectively
- Look for PVT Crossovers – A bullish crossover occurs when PVT crosses above a moving average, while a bearish crossover suggests a weakening trend.
- Monitor Indicator Values – A PVT that makes a higher high confirms strong momentum, while a PVT making a lower high may signal a falling market.
- Use PVT to Confirm Market Trends – The indicator helps confirm trends when used with other trend-following indicators.
- Identify Potential Trend Reversals – When the PVT indicator diverges from price direction, it can warn traders of an impending reversal.
Conclusion & Next Steps
The Price Volume Trend (PVT) indicator is a useful technical analysis tool for traders looking to analyze price and volume trends effectively. By using PVT to measure money flow, confirm trend strength, and detect technical divergence, traders can improve their trading signals and optimize their trading strategies.
However, like all indicators, PVT works best when integrated into a comprehensive trading system. You can enhance your profit potential and reduce risk by integrating it with other tools and indicators, adhering to back-tested strategies.
If you’re ready to build a systematic trading approach that works, explore The Trader Success System for in-depth training on how to apply PVT and other powerful indicators in your trading strategy.


