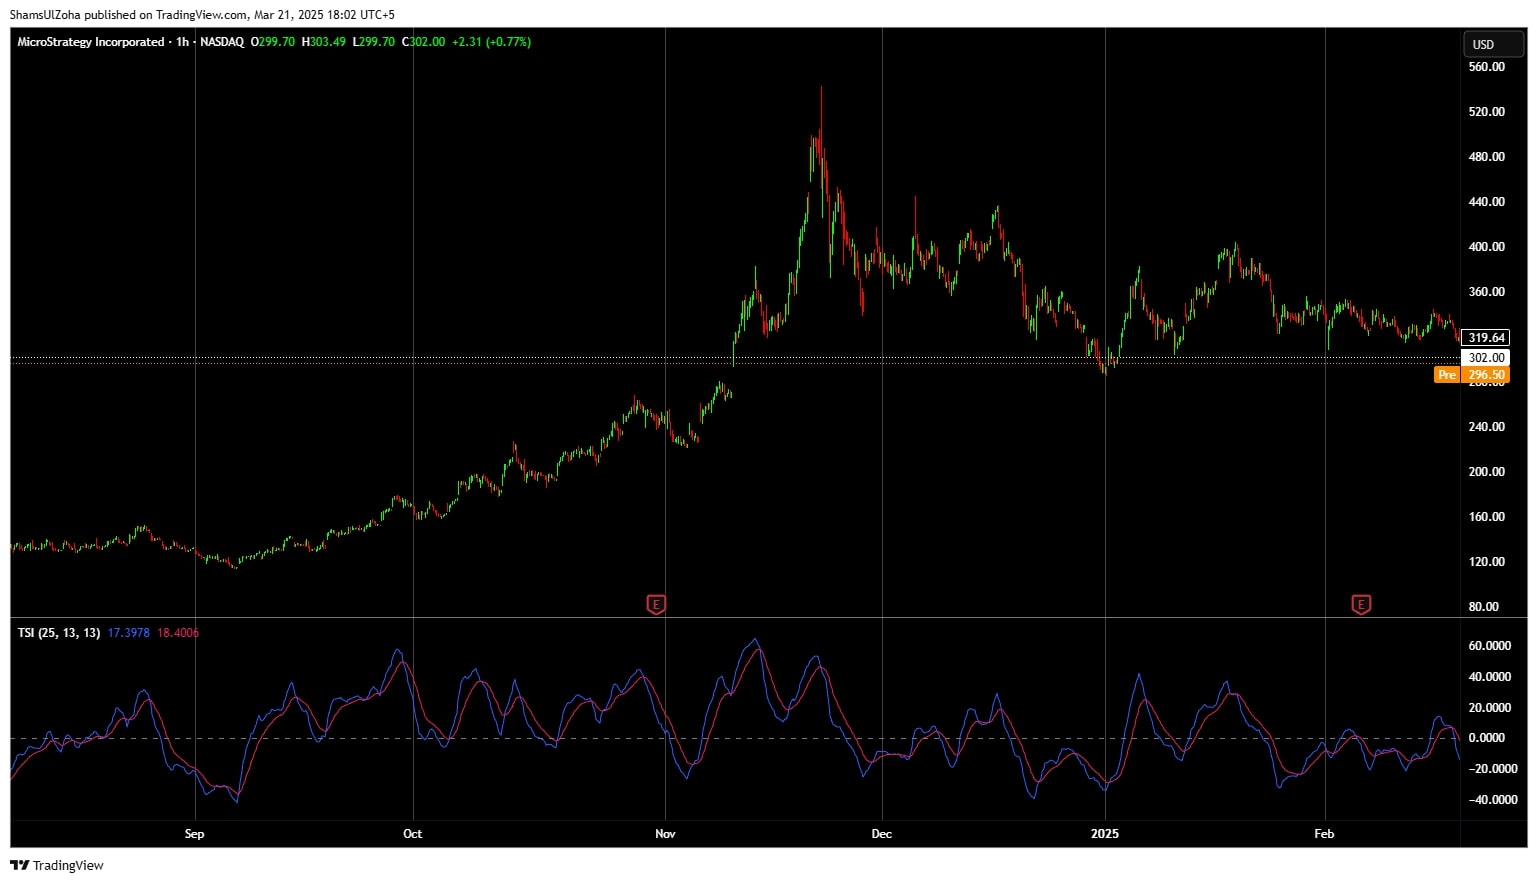
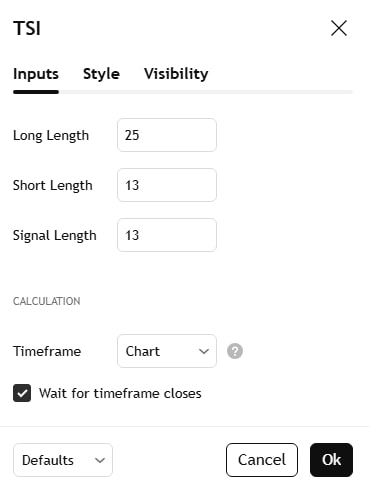
The True Strength Index (TSI) is a momentum oscillator trading indicator designed to identify overbought and oversold conditions in an asset, helping traders predict trend reversals. Developed by William Blau, the True Strength Index indicator uses a double smoothed technique to provide clearer trading signals than many other technical indicators.
To make it more relatable, think of TSI as a speedometer for a vehicle. Just as a speedometer tells you how fast the car is moving, the True Strength Index tells you the rate at which the current price is changing. When price momentum is high, the TSI indicator reflects this, helping traders gauge the strength and direction of a trend.

For systematic traders, the True Strength Indicator is particularly valuable because it provides smoother momentum analysis, reducing false signals and offering more reliable trading signals.
How the True Strength Index (TSI) Works in Trading?
The True Strength Index indicator is calculated by measuring the difference between the current price and previous price to determine momentum and then applying a double smoothed exponential moving average (EMA) to filter out short-term fluctuations.
The TSI values range from +100 to -100. Positive values indicate bullish (upward) momentum, while negative values signal bearish (downward) momentum. A common rule of thumb is that TSI values above +25 suggest a potential bullish trend, while values below -25 indicate a bearish market.
To calculate the TSI:
- Calculate Price Momentum – The difference between the current price and the previous price.
- Apply a 25-period EMA – A double smoothed absolute price change is applied to eliminate market noise.
- Calculate the Absolute Price Change – Using the same exponential moving average technique.
- Determine the Final TSI Value – The final TSI calculation divides the double smoothed price change by the double smoothed absolute price change and multiplies by 100.

The TSI oscillator is commonly used alongside other technical analysis tools like the Relative Strength Index (RSI), Moving Average Convergence Divergence (MACD), and Average True Range (ATR) to improve accuracy in trading decisions.
Systematic Trading Perspective: Why Rules Matter
In systematic trading, clear trading strategies are essential to making objective trading decisions. The TSI indicator fits seamlessly into rules-based strategies, providing trend strength insights that traders can use to identify potential trends.
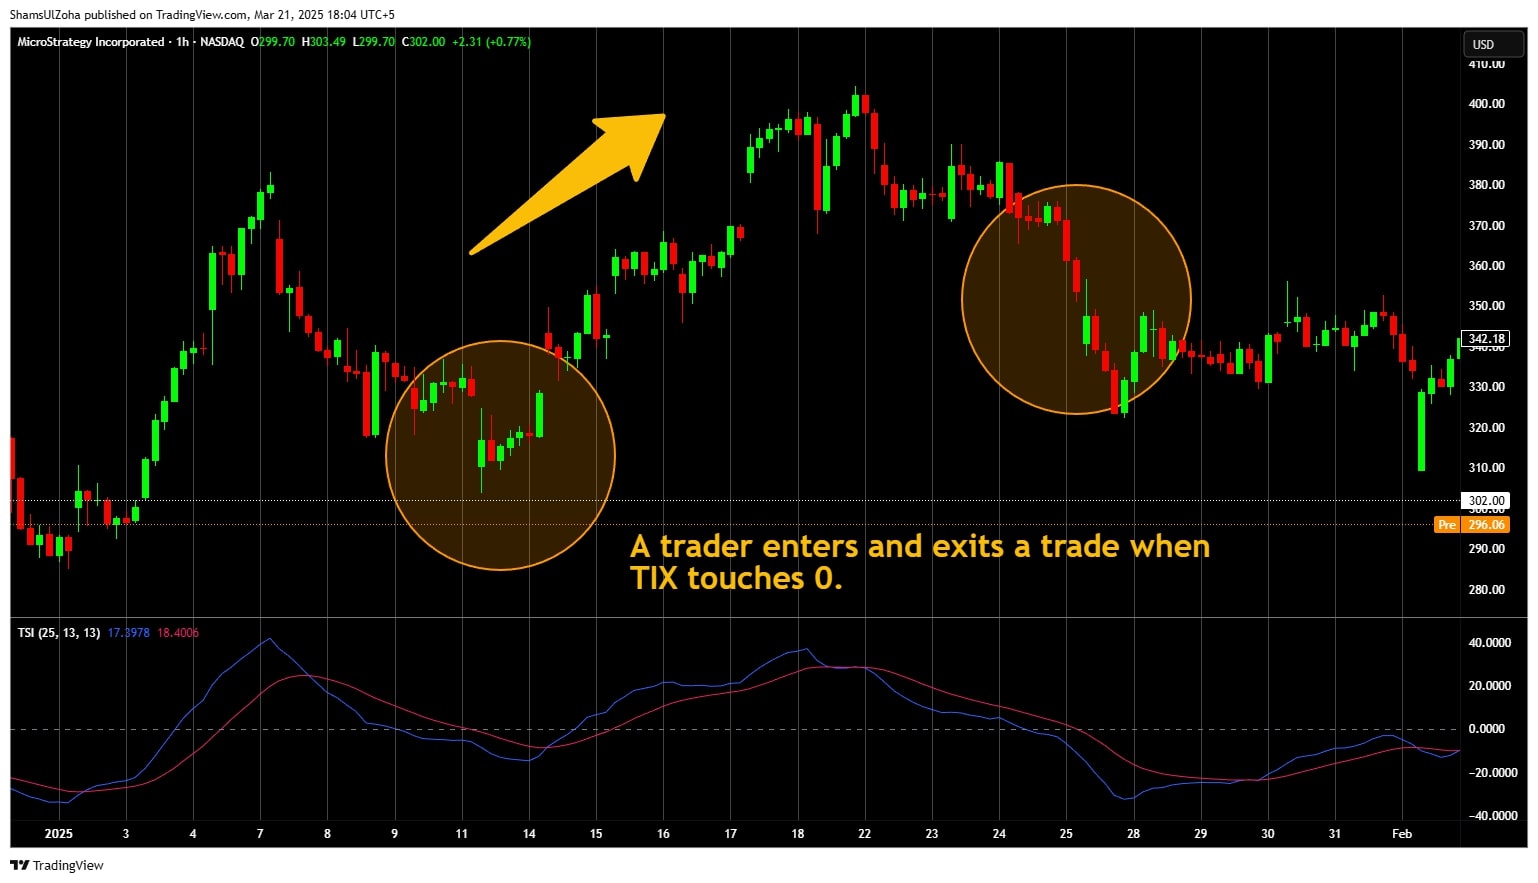
For example, traders may use TSI and price action together to create entry and exit signals:
- Enter a long position when TSI crosses above the zero line (suggesting a bullish trend).
- Exit a long trade when TSI crosses below the zero line (indicating trend weakness).
- Identify trend reversals when divergence occurs between the TSI and price movement.

Backtesting the TSI indicator can help traders refine these rules and develop momentum-based trading strategies that work across different financial markets.
Challenges of Using the True Strength Index (TSI) in a Trading System
While the TSI is an excellent tool for momentum analysis, there are a few common pitfalls traders should be aware of. One challenge is that TSI can sometimes produce false signals. Like any technical indicator, the TSI is not infallible and may occasionally indicate a reversal when one doesn’t occur, this is especially true in volatile or choppy markets.
Another potential issue is that the TSI has a lagging nature. Since it’s based on past price movements, its signals may sometimes come too late, leading traders to miss out on profitable opportunities. This is common in momentum indicators, and it’s why the TSI should be used in conjunction with other indicators to confirm signals.
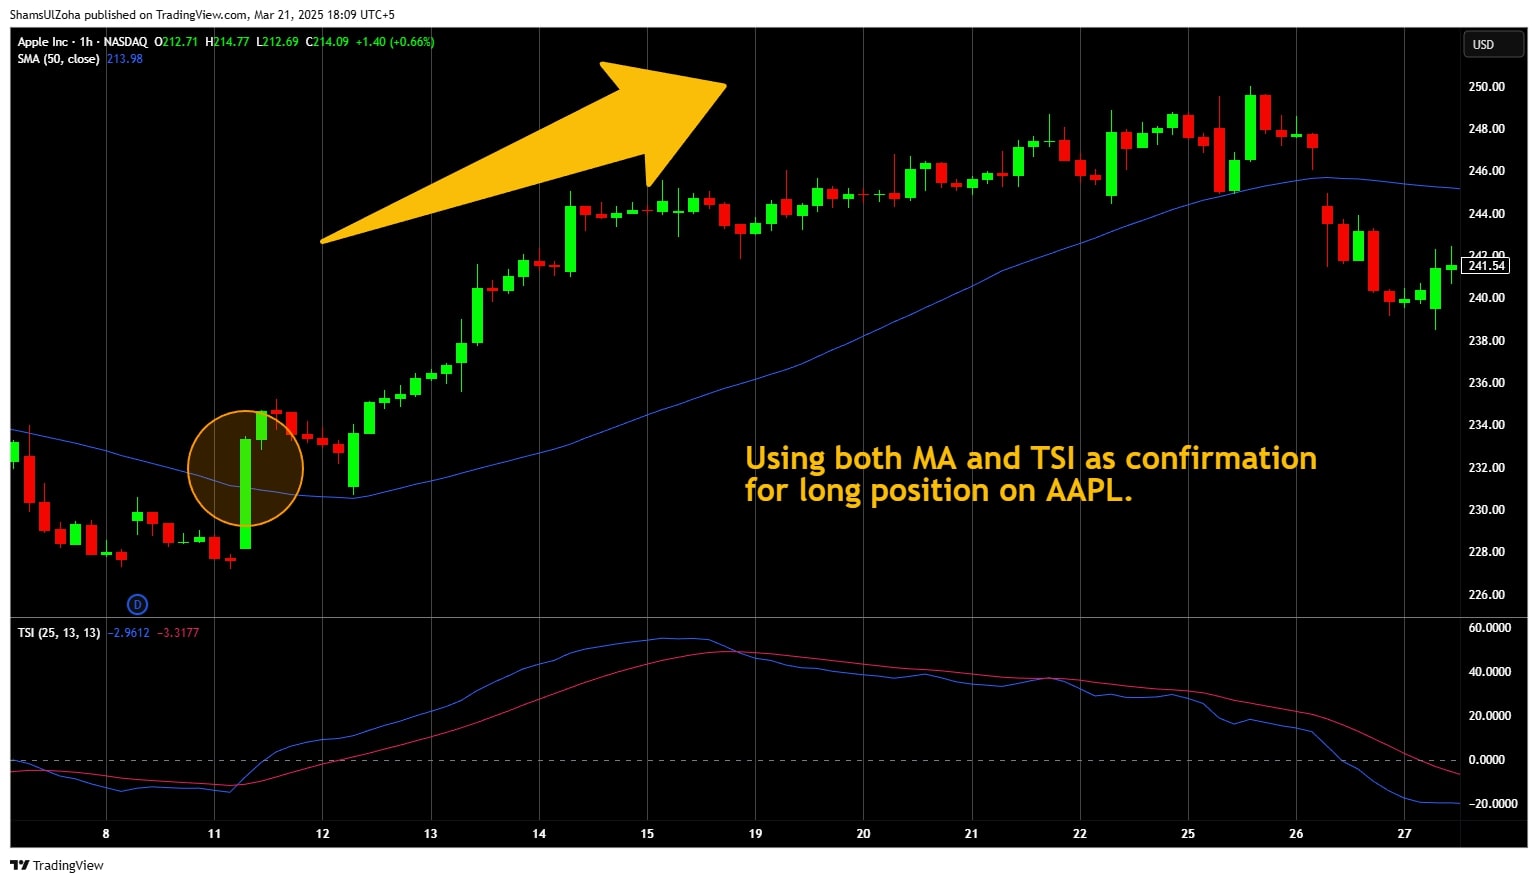
To mitigate these challenges, traders can combine the TSI with other technical tools, such as trend lines, moving averages, or volume indicators, to validate its signals. Additionally, adjusting the TSI’s parameters, such as changing the smoothing periods, can help reduce noise and improve signal accuracy.

Actionable Tips for Using True Strength Index (TSI) Effectively
Here are some actionable tips for leveraging the TSI in your trading strategy:
- Combine with Trend Indicators: The TSI works best when combined with trend-following indicators like moving averages or the Average Directional Index (ADX). Use TSI to confirm the direction and strength of the trend.
- Use Divergence for Reversal Signals: Divergence between the TSI and price action can indicate potential reversals. A bullish divergence occurs when the TSI makes higher lows while the price makes lower lows, suggesting a possible upward reversal.
- Set Thresholds for Overbought and Oversold Conditions: Many traders use TSI to spot overbought and oversold conditions. Consider setting thresholds (e.g., +25 for bullish trends and -25 for bearish trends) based on back-tested data for more consistent results.
- Utilize in Trending Markets: TSI is most effective in trending markets, where it helps identify the trend’s strength. It may produce more false signals in sideways or choppy markets, so caution is advised.
Conclusion & Next Steps
The True Strength Index (TSI) is a powerful momentum oscillator that helps traders identify trend strength, overbought and oversold levels, and trend reversals. By using TSI in combination with moving averages, signal line crossovers, and divergence analysis, traders can improve their entry and exit points in various financial markets.
However, like all technical indicators, TSI works best when used alongside other trading signals and technical analysis tools to reduce false signals.
If you’re looking to develop systematic trading strategies that incorporate the True Strength Index, The Trader Success System can help. Learn how to use TSI effectively, backtest strategies, and build a rules-based trading plan for consistent results. Remember – You are only one trading system away!


