Trading Mean Reversion is a popular strategy that has been extensively studied in several stock markets globally (especially the US stock market and the Australian Stock Exchange). However, despite its popularity, there is still a lack of research on its effectiveness when applied to a broader range of stock markets. In this article, I will be sharing with you the results of a mean reversion trading system applied to a wide range of global stock markets.
One of the main challenges that traders face is inconsistency in their trading results due to insufficient diversification. Trading only one market can result in large drawdowns, especially if that market goes through a strong trending phase for a period of time without pullbacks OR if the market experiences a sudden change of trend that triggers mean reversion trades only to have them all move against you and hit their stop loss point.
Traders tend to focus on one or two large international markets, such as the US stock market, when diversifying internationally. However, this may not be the best move for diversifying your portfolio of trading systems.
In this article, I present the backtests of a simple mean reversion trading system applied to a variety of markets. The results are surprising, with some markets showing exceptional trading opportunities while others suffer from inconsistent results over time. Each market has its unique character, and developing mean reversion trading systems specific to each market requires further research.
The purpose of this article is to demonstrate where mean reversion trading provides traders with a raw edge worth pursuing. I have tested mean reversion trading in various markets, including the Australian market, the US market, the whole common market, Shanghai, the Philippines, Malaysia, Japan, Taiwan, London, many European countries, and others. The results may shock you.
My goal is to make you think more deeply about your global diversification and mean reversion trading system development efforts. This article will hopefully show you that casting your net further afield into alternative markets is an opportunity worth investigating. Remember, developing a mean reversion trading system with a raw edge is crucial before optimization, filtering, and fine-tuning take place.
System Rules For Trading Mean Reversion
For the purpose of this research I have started with a very simple (but effective) mean reversion trading system and applied this to each market. The rules of the stock trend trading system are:
BUY the next bar on open if:
- The stock’s closing price closes down 5 days in a row (Close is less than the previous close)
- The stock’s closing price is above the 200 bar exponential moving average
- The 20 day average turnover (Close * Volume) is greater than 1 million U.S. dollars or equivalent per day
- The 14 bar Average True Range is more than 6% of the closing price
SELL the next bar on open if:
- The stock closes higher than the previous close OR
- The stock closes below the 200 bar exponential moving average OR
- The trade is still open after 10 trading days OR
- The stock falls 40% from the entry price intraday
Position Sizing and Portfolio Management:
- Each trade is allocated 10% of equity
- Maximum of 10 simultaneous positions
- No leverage
Commission and Slippage Assumptions:
- Commissions have been included in the study and have been allocated at 0.25% per side
- Given the generous liquidity requirement used this Commission allowance should be sufficient to cover slippage and commissions in most markets, although this may depend on the commission structure your broker charges you.
Clearly this is not the most sophisticated trading system in the world and in fact inside The Trader Success System, students get access to several high performing mean reversion trading strategies that dramatically outperform this simple system in backtesting.
Despite the simplicity of this system, in many markets it does outperform buy and hold in some markets on a risk adjusted basis (Compound Annual Return divided by average exposure of the system), so this basic strategy for trading mean reversion should serve as an adequate system to compare the “mean reverting” tendency of each market we’ve investigated.
Once a potentially profitable market for trading mean reversion is found using this very raw system a more refined and profitable approach can be developed rather quickly.
Backtesting the Portfolio
The data used for this backtest comes from Norgate for US, TSX and ASX and includes delisted stocks. For other markets the data was sourced from Metastock.
Mean Reversion Trading Statistics
We will evaluate the performance using the following performance metrics:
- Compound Annual Return
- Risk Adjusted Return
- Maximum Historical Drawdown
- CAR/MDD
- Average Profit Per Trade
- Percent Winners
We will also use the shape of the equity curve (plotted on a logarithmic scale) to evaluate how ‘tradeable’ the market is with a trend trading system. Finally we will look at the underwater equity chart to evaluate the drawdown profile.
Stock Markets We Backtested
The stock markets that we have backtested and included in this study include:
- USA
- NYSE
- Nasdaq
- AMEX
- Toronto Stock Exchange (TSX)
- Australian Stock Exchange (ASX)
- Hong Kong Stock Exchange (HKSE)
- Shanghai Stock Exchange
- Taiwan Stock Exchange
- National Stock Exchange of India
- Philippines Stock Exchange
- Malaysia Stock Market (Bursa Malaysia)
- Tokyo Stock Exchange
- Singapore Stock Exchange
- Bovespa Stock Exchange (Brasil)
- London Stock Exchange
- Xetra
- OMX Exchange (Nordic and Baltic)
- Tel Aviv (Israel)
Trading Mean Reversion In US Stock Market
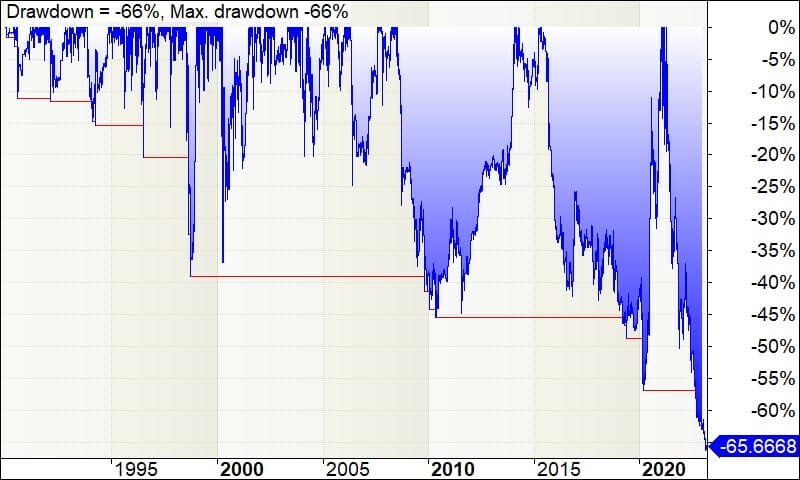
Do not let the headline numbers fool you, just like in my post on Trend Trading US Stocks, the performance of our mean reversion trading strategy on US stocks was underwhelming. While this and many other mean reversion trading strategies did work very well in US stocks up until the Global Financial Crisis in 2007, since then the strategy has basically gone sideways and is now in decline.
It certainly appears as though trading mean reversion (with this strategy) had a huge edge in the 1990’s and 2000’s, this edge has certainly eroded to nothing. This does not mean that all mean reversion trading strategies have stopped working in the US Stock Market, but I have observed that mean reversion in US stocks is getting more and more difficult. In the next section we will look at the different US exchanges separately to understand whether the same findings apply at an exchange level for the NYSE, Nasdaq and AMEX exchanges.
Backtest Statistics – US Mean Reversion Trading
- Annual Return 29%
- Risk Adjusted Return 103%
- system % drawdown -66%
- CAR/MaxDD 0.45
- Average Profit/Loss 0.72%
- Percent Winners 57%
- Average Win / Average Loss 0.97
Backtest Equity Curve for US Mean Reversion Trading (Log Scale):

NYSE Mean Reversion Trading Performance
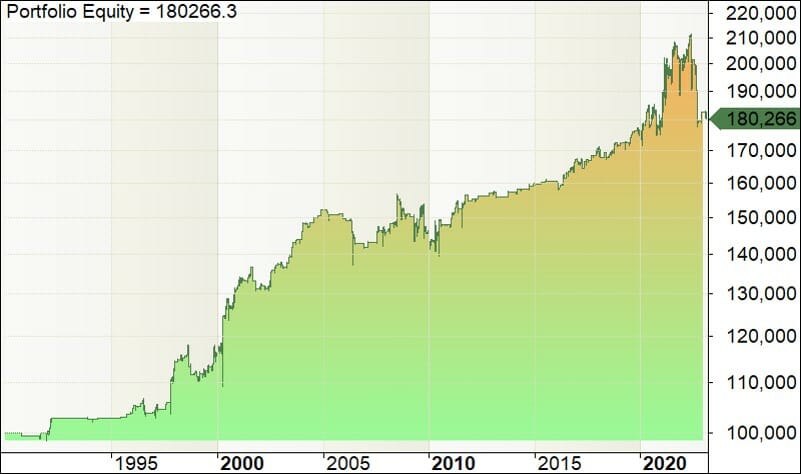
The New York Stock Exchange mean reversion trading performance was quite a bit better than the whole US market combined, the returns from this particular strategy are low, however there is definately potential to improve the system and generate stronger returns. The compound annual return was 1.8% (with a risk adjusted return of 73%) and the drawdown was 16% compared to 66% for the whole market. This implies that within the US Stock Market the different exchanges certainly have quite different performance / behavioural characteristics and the NSYE has much more potential for mean reversion than the broader market.
Based on the performance statistics and the equity curve below it certainly seems as though a viable mean reversion system could be developed for the New York Stock Exchange.
Backtest Performance Statistics for NYSE Stock Market Trend Trading System:
Note that these backtest results are only on currently listed NYSE stocks because the delisted stock history provided by Norgate does not specify which exchange they were listed on prior to delisting. Performance metrics are still useable because despite some survivorship bias in the results, you will see in the delisted stocks section of this analysis that the mean reversion performance for stocks that have now been delisted was actually stronger than for currently listed stocks.
Backtest Equity Curve for NYSE Mean Reversion Trading (Log Scale):

Nasdaq Mean Reversion Performance
The mean reversion trading strategy applied to the Nasdaq stock exchange performed extremely strongly up until 2005, however since that time the performance has been volatile and sideways. My hypothesis is that something structural changed in the market which has reduced the efficacy of mean reversion on the Nasdaq market in 2005 and it has not been worth trading with this style of system since. Note there are certainly other mean reversion systems that perform better, but it is interesting to see such a noticeable change in system behavior.
Backtest Performance Statistics for Nasdaq Mean Reversion Trading:
- Annual Return 4%
- Risk Adjusted Return 41%
- Max. system drawdown -58%
- CAR/MDD 0.07
- Avg. Profit/Loss % 0%
- Winners 56%
- Average Win / Average Loss 0.89
Note that these backtest results are only on currently listed Nasdaq stocks because the delisted stock history provided by Norgate does not specify which exchange they were listed on prior to delisting. Performance metrics are still useable because despite some survivorship bias in the results, you will see in the delisted stocks section of this analysis that the trend trading performance for stocks that have now been delisted was actually stronger than for currently listed stocks.
Backtest Equity Curve for Nasdaq Mean Reversion Trading (Log Scale):


AMEX Mean Reversion Trading Performance
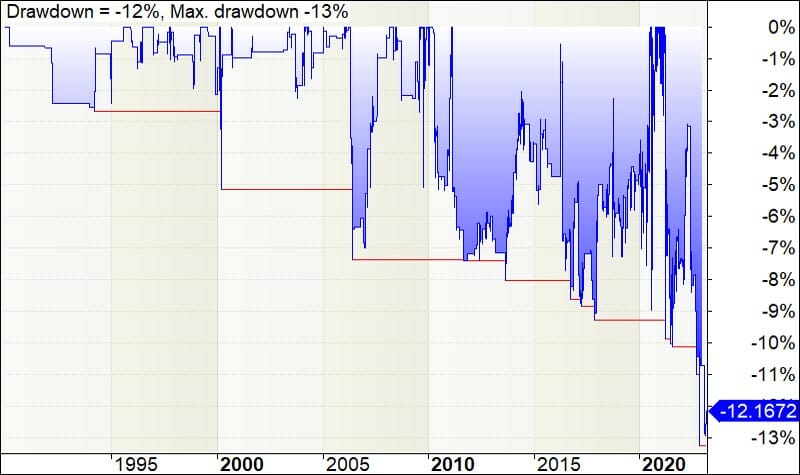
The performance of the mean reversion trading strategy applied to stocks listed on the AMEX exchange (now called the NYSE American) has been much better than the Nasdaq exchange. The compound annual return was only 1% , but the shape and consistency of the equity curve is much more attractive and the drawdown was only 13%. Based on this performance it seems a fair conclusion that stocks listed on the AMEX stock exchange do mean revert and a system could be developed for this exchange.
Backtest Performance Statistics for AMEX Stock Market Trend Trading System:
- Annual Return 1%
- Risk Adjusted Return 113%
- Max. system drawdown -13%
- CAR/MDD 0.11
- Avg. Profit/Loss % 1%
- Winners 57%
- Average Win / Average Loss 1.01
Note that these backtest results are only on currently listed AMEX stocks because the delisted stock history provided by Norgate does not specify which exchange they were listed on prior to delisting. Performance metrics are still useable because despite some survivorship bias in the results, you will see in the delisted stocks section of this analysis that the trend trading performance for stocks that have now been delisted was actually stronger than for currently listed stocks.
Backtest Equity Curve for AMEX Mean Reversion Trading System (Log Scale):

Delisted US Stock Mean Reversion Trading Performance
For discussion of why I am backtesting delisted stocks on their own, see this post on trend trading.
Backtest Performance Statistics for Delisted US Stocks Mean Reversion Trading System:
- Annual Return 25%
- Risk Adjusted Return 132%
- Max. system drawdown -43%
- CAR/MDD 0.59
- Avg. Profit/Loss % 1%
- Winners 58%
- Average Win / Average Loss 1.01
Note that these backtest results are very similar in profile to the mean reversion system applied to the Nasdaq stocks. It is not possible to separate out delisted stocks by main exchange, but my hypothesis is that the behaviour of stocks delisted would be similar to those currently listed on the relevant exchange.
Backtest Equity Curve for Delisted US Mean Reversion Trading System (Log Scale):


Toronto Stock Exchange (TSX) Mean Reversion Trading Performance
The mean reversion trading strategy applied to the Toronto Stock Exchange performs very well and is quite consistent over time. The Canadian market, just as we found in our global trend trading investigation, works very effectively for systematic trading. The compound annual return was 10.6% while only being invested on average 3.8% of the time! The maximum drawdown was 16.5% giving a CAR/MDD of 0.64 without any form of optimization. These results are hugely promising!
This is why in The Trader Success System we provide several great trading systems for the Toronto Stock Exchange. It is one of my favourite markets because a systematic approach works so well there. My theory as to why the Canadian market is so much better than the US market is because there is no algorithmic trading on the Canadian market because the exchange doesn’t allow it. This levels the playing field so everyday investors and traders are not being stolen from by High Frequency trading firms like we do in the US Stock Market.
Backtest Performance Statistics for Toronto Stock Exchange Mean Reversion Trading System:
- Annual Return 11%
- Risk Adjusted Return 282%
- Max. system drawdown -17%
- CAR/MDD 0.64
- Avg. Profit/Loss % 2%
- Winners 62%
- Average Win / Average Loss 1.21
Backtest Equity Curve for Toronto Stock Exchange Mean Reversion Trading System (Log Scale):


Australian Stock Exchange (ASX) Mean Reversion Trading Performance
The mean reversion trading strategy applied to the Australian Stock Exchange performs pretty respectably considering how simple the system is. The compound annual return was 2.4% while being invested only 2.9% of the time on average. This gives us a very healthy risk adjusted return of 184%. The maximum drawdown was 18% resulting in a CAR/MDD of 0.29.
The edge seems to be stable with the equity curve maintaining a steady slope for the life of the backtest. One concern, however, is the increasing size of the drawdowns over time. This indicates the system is becomming more risky over time, however this could most likely be addressed by finetuning the system for the Australian market and with the addition of a regime filter.
Mean reversion trading systems are still very profitable on the Australian Stock Exchange and I have a number of highly effective systems that use mean reversion trading strategies which are included in The Trader Success System.
Backtest Performance Statistics for The ASX Mean Reversion Trading System:
- Annual Return 5%
- Risk Adjusted Return 185%
- Max. system drawdown -18%
- CAR/MDD 0.29
- Avg. Profit/Loss % 2%
- Winners 59%
- Average Win / Average Loss 1.14
Backtest Equity Curve for ASX Mean Reversion Trading System (Log Scale):


Hong Kong Stock Exchange (HKSE) Mean Reversion Trading Performance
If you have watched some of my YouTube videos then you are probably aware that I am a big fan of the Hong Kong Stock Exchange as a source of diversification for my trading… unfortunately I have found that mean reversion trading does not work very well on the HKSE because it is a very momentum driven market. As you will see from the results below, the performance is uninspiring, although there may be some potential to fine-tune the mean reversion strategy to this market, it does not look nearly as promising as the TSX or ASX.
The mean reversion strategy applied to the Hong Kong Stock Exchange generated a compound annual return of just 2.7% with a maximum drawdown of 66%. The drawdown could almost certainly be reduced with the addition of a market regime filter, though this raw system is not particularly appealing for further development.
Regardless of the prospects for mean reversion trading in Hong Kong, I do include a highly profitable and stable swing trading system for the Hong Kong market in The Trader Success System which I use to get some excellent performance and diversification in my own portfolio. I also include and excellent short selling system for Hong Kong which performs very well during bear markets.
Backtest Performance Statistics for Hong Kong Stock Exchange Mean Reversion Trading System:
- Annual Return 3%
- Risk Adjusted Return 29%
- Max. system drawdown -66%
- CAR/MDD 0.04
- Avg. Profit/Loss % 0%
- Winners 56%
- Average Win / Average Loss 0.90
Backtest Equity Curve for Hong Kong Stock Exchange Mean Reversion Trading System (Log Scale):


Shanghai Stock Exchange Mean Reversion Trading Performance
Our mean reversion trading strategy applied to the Shanghai stock market is a poor perfromer. Generating an annual return of just 1.1% with a maximum drawdown of 44% and growing! I will not be investigating mean reversion trading strategies for Shanghai any time soon 😉
Backtest Performance Statistics for Shanghai Stock Exchange Mean Reversion Trading System:
- Annual Return 1%
- Risk Adjusted Return 16%
- Max. system drawdown -44%
- CAR/MDD 0.02
- Avg. Profit/Loss % 0%
- Winners 59%
- Average Win / Average Loss 0.76
Backtest Equity Curve for Shanghai Stock Exchange Mean Reversion Trading (Log Scale):


Taiwan Stock Exchange Mean Reversion Trading Performance
Our mean reversion trading strategy applied to the Taiwan stock market is extremely promising. Generating an annual return of 5% with a risk adjusted return of 200% and generating a very modest max drawdown of just 10.4%. The main potential challenge will be trading costs and market accessibility since we cannot trade the Taiwan Stock Exchange through Interactive Brokers who I use for my stock trading so another broker will be required.
Backtest Performance Statistics for Taiwan Stock Exchange Mean Reversion Trading System:
- Annual Return 5%
- Risk Adjusted Return 200%
- Max. system drawdown -10%
- CAR/MDD 0.48
- Avg. Profit/Loss % 1%
- Winners 65%
- Average Win / Average Loss 0.96
Backtest Equity Curve for Taiwan Stock Exchange Mean Reversion Trading (Log Scale):


Indian Stock Market (NSE) Mean Reversion Trading Performance
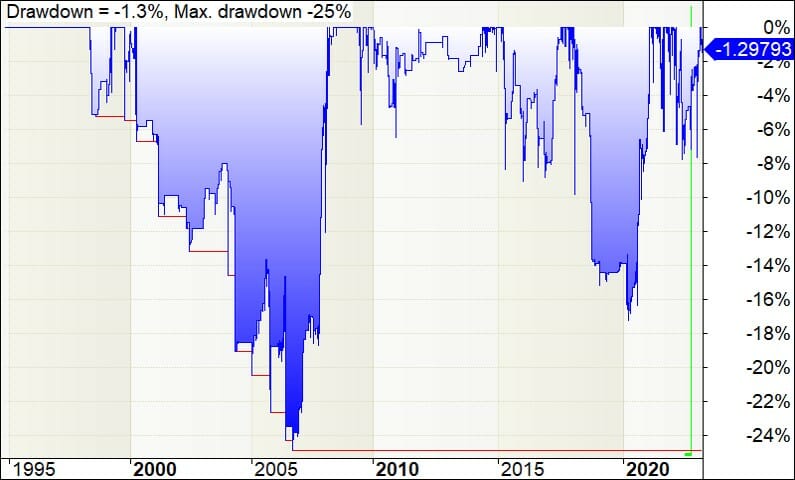
One of the most unfortunate realities for the globally diversified stock trader is that unless you are an Indian National, you cannot practically trade Indian stocks. They are very nicely diversified from other markets and I have found they respond well to a variety of systematic trading approaches. Mean reversion is no different – our simple mean reversion trading strategy generated 3.6% compound annual return with an average exposure of just 3.6% (how’s that for symmetry). This low average exposure results in a risk adjusted return of 101%. Our system generated over 1300 trades so there is lots of room for refinement, filtering and optimization to improve these results.
Backtest Performance Statistics for Indian Stock Market (NSE) Mean Reversion System:
- Annual Return 4%
- Risk Adjusted Return 101%
- Max. system drawdown -25%
- CAR/MDD 0.15
- Avg. Profit/Loss % 1%
- Winners 63%
- Average Win / Average Loss 0.82
Backtest Equity Curve for Indian Stock Market (NSE) Mean Reversion System (Log Scale):

Philippines Stock Exchange Mean Reversion Trading Performance
Our mean reversion trading strategy applied to the Philippines Stock Exchange only generated 111 trades over the entire backtest. This is most likely due to the high level of liquidity required by the system before generating a trade. As a result of this small number of trades it is not clear whether the strategy has much potential, but I would suggest it is worth skipping this market for mean reversion because there are other markets that are much more liquid and provide very promising equity curves and performance statistics.
Backtest Performance Statistics for Philippines Stock Exchange Mean Reversion System:
- Annual Return 1%
- Risk Adjusted Return 215%
- Max. system drawdown -9%
- CAR/MDD 0.07
- Avg. Profit/Loss % 2%
- Winners 67%
- Average Win / Average Loss 0.83
Backtest Equity Curve for Philippines Stock Exchange Mean Reversion System (Log Scale):


Bursa Malaysia Stock Exchange Mean Reversion Trading Performance
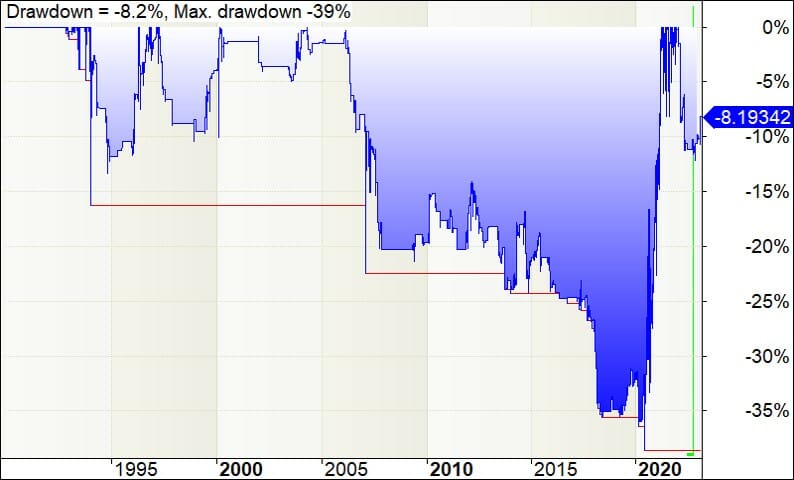
Despite being profitable (just), our mean reversion trading strategy is not very promising when applied to the Malaysian Stock Exchange. There is a 15 year period from 2005 to 2020 where the system is in drawdown followed by a sudden rally in 2020. This is not consistent enough to warrant further attention.
Our mean reversion trading strategy returned just 1.4% return per year with a 39% maximum drawdown. Based on these numbers it is clear there are more profitable mean reversion markets to trade, so I would stop my research into mean reversion in this market here.
Backtest Performance Statistics for Bursa Malaysia Stock Exchange Mean Reversion Trading System:
- Annual Return 1%
- Risk Adjusted Return 42%
- Max. system drawdown -39%
- CAR/MDD 0.04
- Avg. Profit/Loss % 0%
- Winners 56%
- Average Win / Average Loss 0.93
Equity Curve – Bursa Malaysia Stock Exchange Trend Trading

Tokyo Stock Exchange Mean Reversion Trading Performance
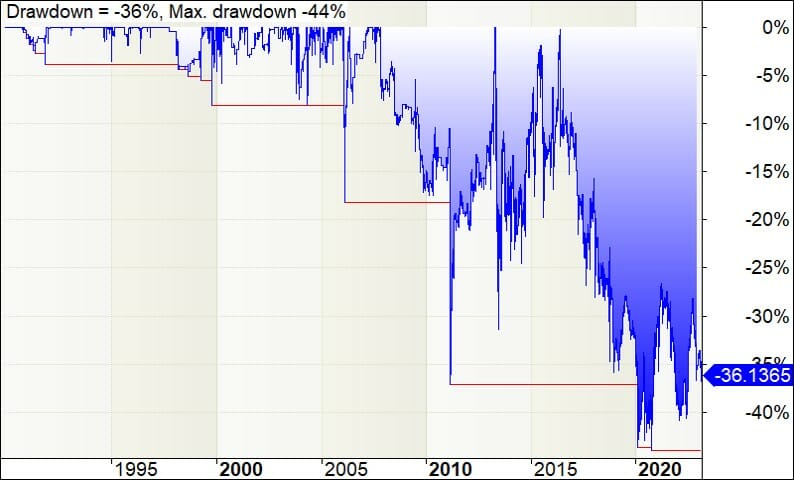
I mentioned in my previous investigation into global trend trading that I have not yet found a really good trading system for the Japanese stock market. Sadly this mean reversion investigation has not changed that. The compound annual return for our mean reversion strategy in Tokyo was 5% with a maximum drawdown of 44%, however this does not tell the full picture – the strategy stopped working in around 2007 and has not made money since then.
Backtest Performance Statistics for Tokyo Stock Exchange Mean Reversion System:
- Annual Return 5%
- Risk Adjusted Return 50%
- Max. system drawdown -44%
- CAR/MDD 0.12
- Avg. Profit/Loss % 0%
- Winners 54%
- Average Win / Average Loss 1.02
Backtest Equity Curve for Tokyo Stock Exchange Mean Reversion Trading System (Log Scale):

Singapore Stock Exchange Mean Reversion Trading Performance
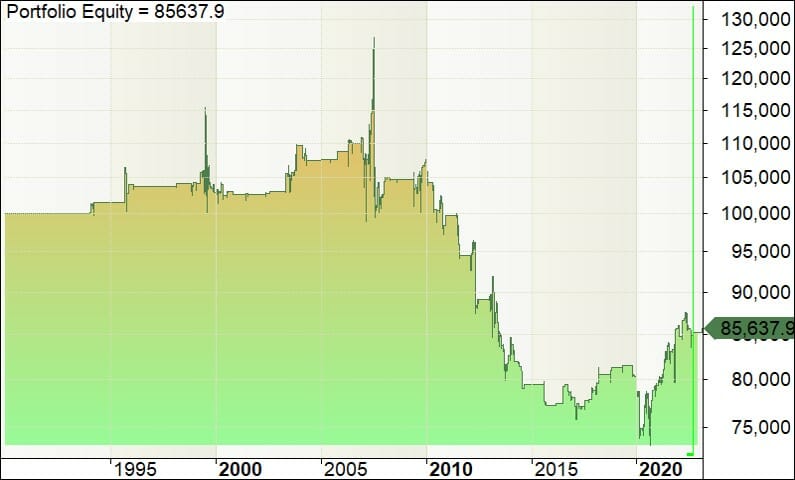
Unfortunately the Singapore stock market does not seem to lend itself well to systematic trading. As I also found in my investigation into global stock trend following, the performance is erratic and unprofitable.
The average annual return was -0.5% in the backtest with a maximum drawdown of 42% indicating that there is not much potential for this style of trading on the Singapore stock exchange.
Backtest Performance Statistics for Singapore Mean Reversion Trading System:
- Annual Return 0%
- Risk Adjusted Return -26%
- Max. system drawdown -42%
- CAR/MDD -0.01
- Avg. Profit/Loss % 0%
- Winners 48%
- Average Win / Average Loss 1.03
Backtest Equity Curve for Singapore Mean Reversion Trading System (Log Scale):

Bovespa (Brazil Stock Market) Trend Trading Performance
The Brazil Stock Market (called Bovespa) came to my attention just recently because I have a student in The Trader Success System who asked for help adapting my systems to the Bovespa. As a result I am particularly interested to have a much closer look at this market.
Our simple mean reversion trading strategy applied to Bovespa only managed to breakeven, so in this case there is not a lot to work with. Similar to some of the other smaller markets I have tested in this article, I suspect a large part of the issue is finding enough stocks with sufficient liquidity to pass our entry criteria. The backtest only generated 149 trades over the 30 years. I am not planning any further mean reversion investigations into the Bovespa market at this point.
Backtest Performance Statistics for Bovespa (Brazil Stock Market) Mean Reversion System:
- Annual Return 0%
- Risk Adjusted Return 7%
- Max. system drawdown -9%
- CAR/MDD N/A
- Avg. Profit/Loss % 0%
- Winners 52%
- Average Win / Average Loss 0.97
Backtest Equity Curve for Bovespa (Brazil Stock Market) Mean Reversion System (Log Scale):


London Stock Exchange Mean Reversion Trading Performance
The London Stock Exchange (LSE) is a great exchange to trade for international diversification. I have found trend trading strategies to work well on the LSE and in this investigation I also found mean reversion trading strategies to work well too. Our simple mean reversion trading strategy generated an annual return of 2%, but the average exposure was only 1% resulting in a risk adjusted return of 201%! The maximum historical drawdown was a bit high for comfort at 16%, but this could most certainly be improved with the addition of a market regime filter.
Backtest Performance Statistics for London Mean Reversion Trading System:
- Annual Return 2%
- Risk Adjusted Return 202%
- Max. system drawdown -17%
- CAR/MDD 0.13
- Avg. Profit/Loss % 1%
- Winners 59%
- Average Win / Average Loss 1.15
Backtest Equity Curve for London Mean Reversion Trading System (Log Scale):

XETRA Mean Reversion Trading Performance
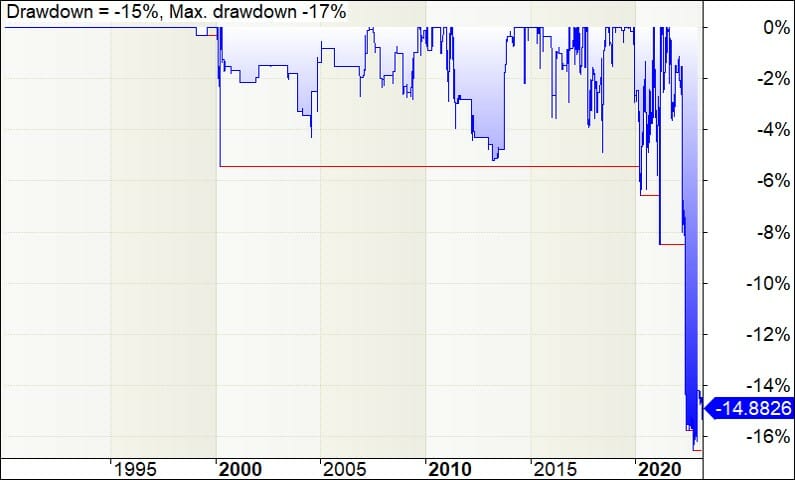
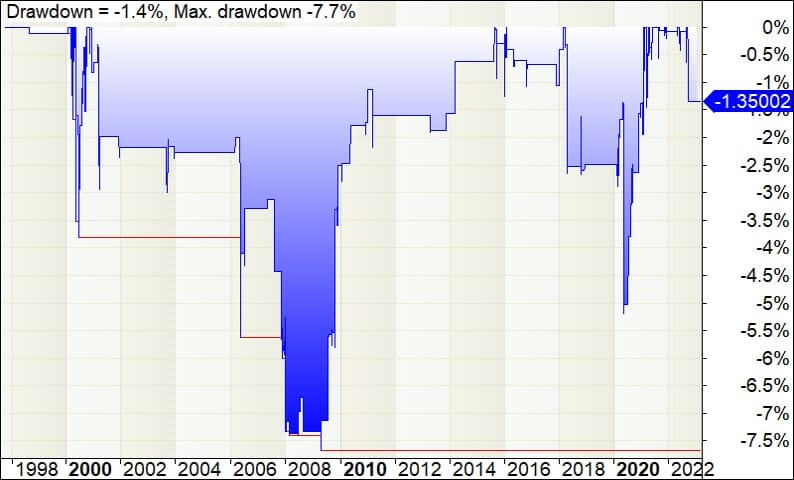
The XETRA exchange is the main exchange for German stocks and ETFs and one of the biggest exchanges in Europe. When I applied our simple mean reversion trading strategy I was therefore surprised to see that it did not generate very many trades at all – just 151 over the life of the backtest. With so few trades it is challenging to see get excited about the strategy / market combination.
As a result of the low number of trades the annual return was low at just 0.8% pa. and the maximum drawdown was 7.7%. Looking at the equity curve though, there may be some potential to develop a more compelling system, however my first choice would be to look to other markets like Canada or Australia which had much higher raw performance figures.
Backtest Performance Statistics for XETRA Mean Reversion Trading System:
- Annual Return 1%
- Risk Adjusted Return 194%
- Max. system drawdown -8%
- CAR/MDD 0.10
- Avg. Profit/Loss % 1%
- Winners 64%
- Average Win / Average Loss 0.94
Backtest Equity Curve for XETRA Mean Reversion Trading System (Log Scale):

OMX Exchange Mean Reversion Trading Performance
The OMX Exchange is owned by Nasdaq and is an exchange that covers stocks in the Nordic and Baltic countries. In this analysis I combined all of the markets covered by OMX to give a total of ~1500 stocks which are mostly in Sweden.
The compound annual return from our simple mean reversion trading system applied to the OMX Exchange was quite low at just 1%, however the risk adjusted return was 158% because the system was only in the market 0.6% of the time. There were a couple of bad trades which caused a drawdown of 13% which would need to be addressed to make the system tradeable, but there is certainly potential here. The equity curve is a nicer shape than many of the markets and it looks from the underwater equity curve like most of the drawdown was a single trade. This trade will need to be investigated further to determine whether it could reasonably be expected to repeat itself or if it was a result of bad data or some other one off cause (quite possibly a stock split that was not correctly adjusted for).
Interestingly in our trend trading investigation we also found that the OMX exchange had very good potential. For traders looking to diversify into European stocks, the OMX exchange would certainly be worth looking into.
Backtest Performance Statistics for The OMX Exchange Mean Reversion Trading System:
- Annual Return 1%
- Risk Adjusted Return 158%
- Max. system drawdown -13%
- CAR/MDD 0.08
- Avg. Profit/Loss % 1%
- Winners 57%
- Average Win / Average Loss 1.14
Backtest Equity Curve for the OMX Exchange Mean Reversion Trading System (Log Scale):


Tel Aviv Stock Exchange Mean Reversion Trading Performance
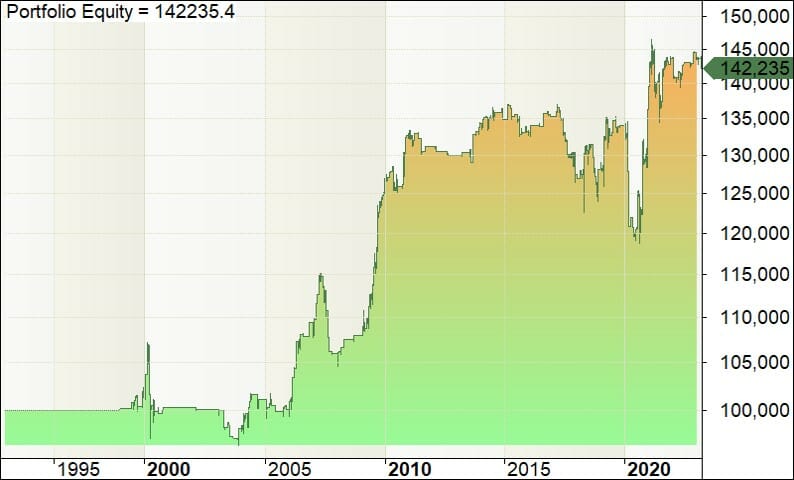
The Tel Aviv stock exchange is the only exchange in Israel. I have not seen a lot of commentary about the exchange so I thought it might be interesting to test our simple mean reversion trading system and see how well it works. The data set I have includes around 900 stocks.
The compound annual return from our simple mean reversion strategy applied to the Tel Aviv Stock Exchange was 1% with a risk adjusted return of 70%. While the raw return is certainly not exciting because of the very low exposure (1.7%), the system is profitable, the shape of the equity curve is promising and there are enough trades to work with (641) to improve the system. I believe this justifies a closer look!
Backtest Performance Statistics for The Tel Aviv Stock Exchange Mean Reversion Trading System:
- Annual Return 1%
- Risk Adjusted Return 70%
- Max. system drawdown -13%
- CAR/MDD 0.09
- Avg. Profit/Loss % 1%
- Winners 55%
- Average Win / Average Loss 1.00
Backtest Equity Curve for the Tel Aviv Stock Exchange Mean Reversion Trading System (Log Scale):

Conclusion on Global Stock Markets Mean Reversion Trading
As we have seen, there are many stock markets around the world that have great profit potential for mean reversion trading strategies. It is interesting to note that just like in our global stock trend trading investigation the NYSE and AMEX exchanges in the US performed better than Nasdaq in recent times.
There are a lot of markets that do not seem to have much potential for the mean reversion strategy shared in this article, however some that do warrant further attention include:
- NYSE
- AMEX
- TSX (Canada)
- ASX (Australia)
- Taiwan
- India
- London
- OMX (Nordic and Baltic)
- Tel Aviv
I hope this has opened your eyes to the fact that there is more to global stock trading than just US (or Nasdaq) stocks. There is huge potential in many of these other markets and an internationally diversified approach as I teach in The Trader Success System is hugely beneficial for your long run returns and risk management. When you join The Trader Success System you will learn:
- how to apply mechanical trading systems like this to reduce the time your trading takes to just 20-30 minutes a day
- eliminate the impact of your emotions on your trading by building rock solid confidence through backtesting
- smooth your returns by implementing a diversified portfolio of trading systems that cover a variety of markets / strategies / timeframes
- over a dozen trading strategies that you can pick up and use immediately with more added every month
If you want to become a consistent and confident systematic trader who has the global markets at your fingertips, then join The Trader Success System today. When you do you will get immediate access to many complete trading systems that are substantially better than this simple system we have tested in this article.


Thanks Adrian, very interesting study.
Thanks for reading Van – Great to have you here!
I am trying to replicate the TSX results. I have Norgate data for the Canadian market and it includes the delisted stocks. What watchlist did you use for your backtest? I have tried several of them and cannot get close to your results. I am only getting a CAR of 1.3% and exposure of 1.2%. I cannot figure out what I am doing wrong. Any ideas would be appreciated.
Hi Larry,
I would have tested this on all listed TSX stocks plus delisted if I remember correctly.
Adrian