In my article “Backtesting Your Emotions To Build Confidence In Your System” we have talked about backtesting to build confidence in your trading system. What happens as soon as most traders learn about automated backtesting is they jump to Optimization.
Optimization is the act of varying the parameters of your trading system to improve profitability. You can ask questions like “what is the best moving average for my exit?” Or “how many bars should I use for my entry breakout?”
With automated backtesting software like Amibroker it is extremely easy to answer questions like this… if you approach it the right way. If you don’t then optimization could prove to be a disaster.
Let’s test this out let’s take our trading system we have been working with for the last two articles and optimize it. We will use the same trading system rules as previous articles for consistency.
Entry Rules: Buy tomorrow at the open if the average turnover for the last 20 bars is over $500k the close is the highest close for the last 500 bars.
Exit: Sell tomorrow at the open if the stock closes below the 200 bar moving average.
Initial Stop: 6 times the average true range below your entry price.
Risk Management: Risk 0.5% of your account on each trade, don’t use leverage. Give highest priority to new trades which have moved by the greatest % over the past 200 trading days.
To keep things simple let’s Optimize:
- Bars in the moving average exit:
We will vary this from 100 to 600 in steps of 50
(11 values – 100, 150, …. , 550, 600) - Bars in the entry breakout:
We will vary this from 50 to 400 in steps of 25
(15 values – 50, 75, … , 375, 400) - Average True Range multiple of our stop loss:
We will vary this from 1 to 10 ATR in steps of 1
(10 values – 1, 2, … , 9, 10)
This can be done in Amibroker simultaneously to find out the best possible combination of these three rules. This will give us a total of 11x15x10 = 1,650 combinations. This type of optimization where we test all possible combinations to find the best is called a brute force optimization.
What are we optimizing for?
The obvious question that most traders ask when they optimize their system is “what parameters give the best performance for this trading system?”.
I want to show you how effective this objective is for future trading, so I am only going to Optimize using data from 1990-2009 (the in-sample timeframe) and then we can test the best parameter combination on future data from 2009-present (the out of sample time frame) to see how well it would have worked in real time trading. The out of sample timeframe gives us a proxy for real time trading on unseen data.
Most traders tend to think first about how much money they can make, so we will choose the combination of parameters that gave the best compound annual return over the test period.
Backtesting all 1,650 combinations in Amibroker on half of the stocks in the ASX took just 8 minutes. The highest compound annual return was 22.8% with a maximum drawdown of 35%. The parameter combination that gave the best in-sample return was:
| Trend filter moving average bars | 200 |
| Breakout entry bars | 300 |
| Average true range stop loss multiple | 2 |
The “in sample” equity curve for the optimized parameters is shown below. The Performance for this ‘best’ set of parameters looks pretty great doesn’t it. We could be forgiven for getting a bit excited at this point!

Equity Curve
However, this is the result of a single brute force optimization where we selected the one combination that gave the highest returns from the in-sample period. The question we need to ask before we get excited is “Will this performance hold up in future trading?”
Luckily we saved some data from 1/1/2009 to present. We can now use this “out of sample” data to walk our optimization forward to see if the chosen parameters hold up in the future.
Comparing the backtest for the in and out of sample periods we get some quite different results:
| Performance measure | In sample period 1990-2009 | Out of sample period 2009-2020 |
| Compound annual return (CAR) | 23% | 14% |
| Maximum drawdown (MDD) | 35% | 31% |
| CAR/MDD | 0.64 | 0.43 |
The return in the out of sample “walk forward” period was a lot worse than the in sample period, and the drawdown remained basically the same. Something went wrong! What happened to our system’s performance?
The problem is all the brute force optimization did was find the best combination of parameters in the past… in system development terms, we “curve-fit the system” to past data. The result is that the performance degrades in real time trading. This is exactly what we saw in our out of sample results!
How to avoid curve-fitting during optimization
The trouble is we asked the wrong question when we optimized the system above. We effectively asked “what were the best parameters in our in-sample time window”.
But the past and the future are not exactly the same, so the best combination in the past is not likely to be the best combination in the future (as we have just seen). As traders we can only place trades on real time data, but we only have the past to base our trading system design on. Solving this conundrum requires us to ask a different question.
Old Question:
“What parameter combination gives the best backtest results”
New Question:
“What parameter combination will give me the greatest chance of future profitability?”
If we can answer this new question using the past data in our backtesting we can give ourselves a better chance of success when trading on future real time data.
Optimal results from the past mean nothing if the performance is not stable over time, or if the system does not work in future real time trading. So our optimization needs to uncover profitable, and stable parameter values that are likely to continue working in the future.
Stable Parameter Values
When we choose parameters for our trading system we want them to be stable. This means the performance of the system does not change much if we vary the parameters either side of our chosen value. We want stability because a stable parameter value is more likely to continue working in the future, even if the market changes over time.
A simple but powerful way you can see how stable your parameter values are is to vary each parameter over a wide range while holding all other parameters constant. The great thing is we already have the data we need from when we ran the brute force optimization.
Holding the breakout bars and stop loss multiple constant at 300 and 2 respectively, when we vary the number of bars in the trend filter we get the following result. The grey bars represent the compound annual return during the in-sample period, and the yellow bars represent the maximum system drawdown:

Trend Filter Duration
You can see the previously chosen “optimal” parameter value of 200 highlighted in black and red. The red arrow shows a clear problem. When the trend filter duration is shortened just a little the compound annual return drops a lot. This is a bad sign! The performance is much more stable around 225 bars as indicated by the green arrow.
When we hold the trend filter bars and the stop loss multiple constant and vary the breakout bars we see the following performance variation:

Entry Breakout Length
Using a similar reasoning as above we see that the breakout bars are unstable in our chosen area. Sacrificing some of the backtested performance for greater stability we should move our breakout bars to an area of stability like 150.
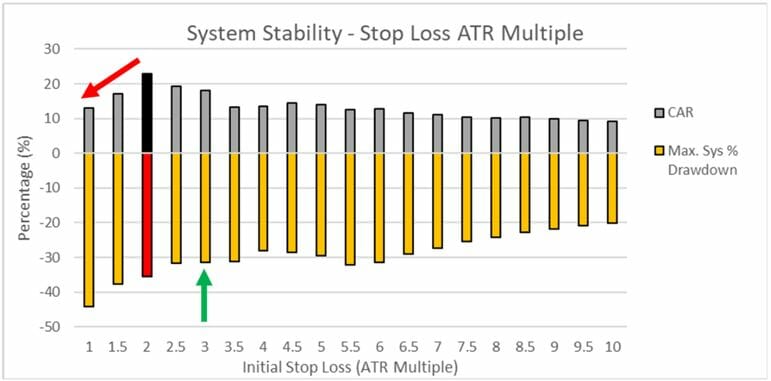
Finally for the stop loss width we see that to initial stop loss is also a little unstable and should be widened a little to improve our chance of future profitability.

Initial Stop Loss
Pulling all of these revised parameter values together we can now get a more realistic backtest which should also better reflect the performance we might get in real time trading. We can test this by backtesting this new “stable” parameter set on the out of sample data.
Stable Parameter Set:
| Trend filter moving average bars | 225 |
| Breakout entry bars | 150 |
| Average true range stop loss multiple | 3 |
The backtested performance for the stable parameter set is shown below for the in-sample and out of sample timeframes:
| Performance measure | In sample period 1990-2009 | Out of sample period 2009-2020 |
| Compound annual return (CAR) | 19% | 18% |
| Maximum drawdown (MDD) | 38% | 40% |
| CAR/MDD | 0.50 | 0.44 |
These out of sample performance is very similar to the in sample performance, which gives us greater confidence for real time trading. The stability focused optimization makes a huge difference!
Conclusion
As you can see your system will hold up far better in future real time trading when you optimize your parameters for maximum stability rather than blindly choosing the single “best” parameter combination from your optimization.
As systematic traders we need to get past our desire to generate the best possible backtest and instead invest our time and energy in designing and optimizing our systems to be as stable as possible so we have a greater chance of profiting in real time trading.
This article was written by Adrian Reid, Founder of Enlightened Stock Trading and was first published in Your Trading Edge Magazine


Share This
Share this post with your friends!