Many traders look at a stocks 52 week highs and lows to make trading decisions, but is there really a profitable systematic edge that you can capture by using a stock trading indicator as simple as the 52 week highs or lows? In this article I will investigate various ways of using the 52 week highs and lows to identify if there is any meaningful edge that could be developed into a profitable trading system.
What are stocks 52 week highs and lows?
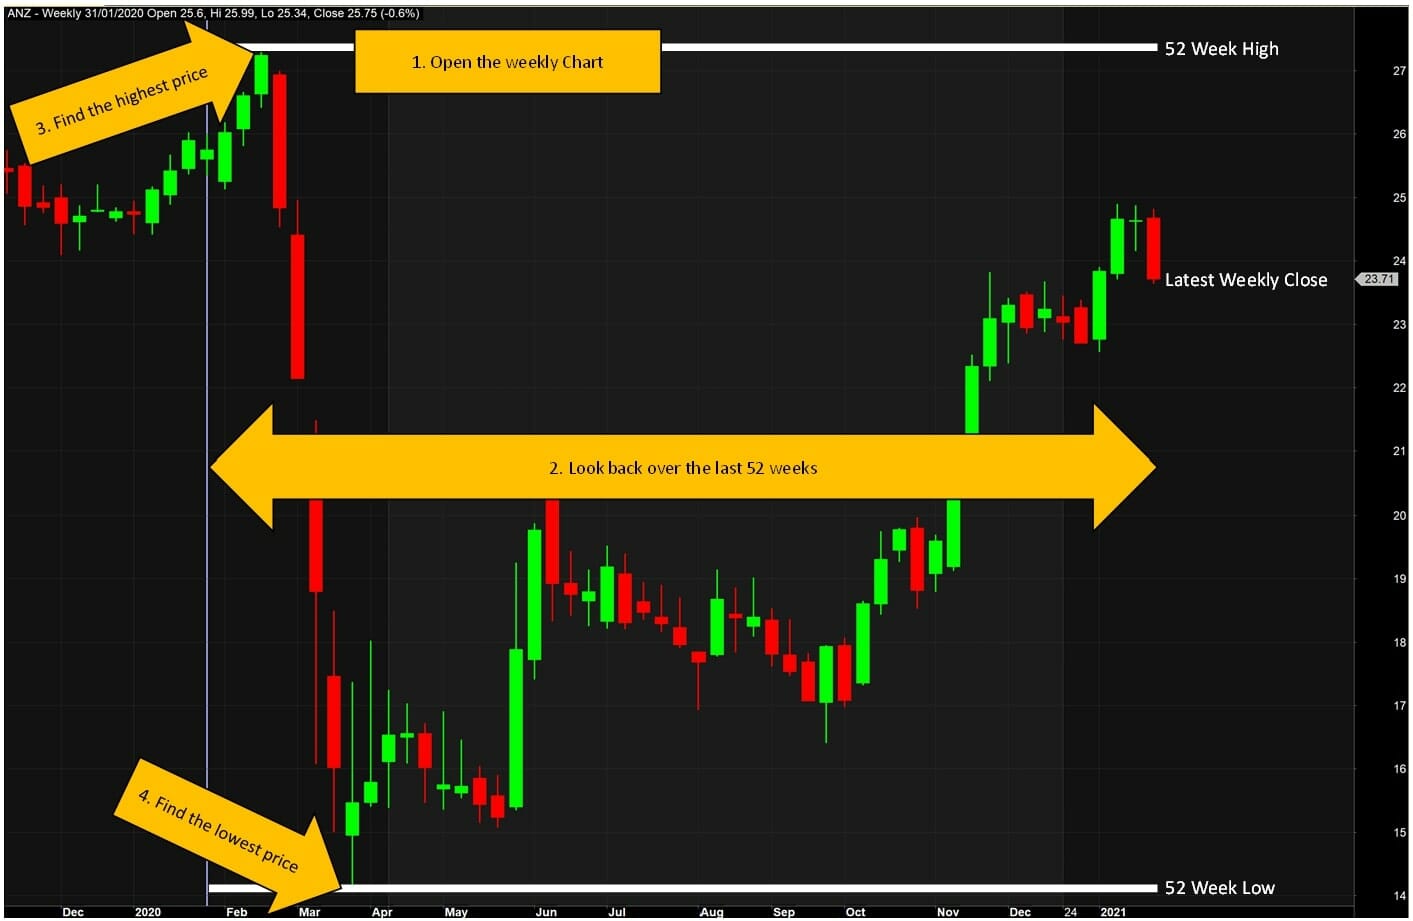
The 52 week high of a stock is simply the highest price that the stock has achieved over the past 52 weeks. Conversely, a stocks 52 week low is the lowest price the stock has achieved over the past 52 weeks. This is illustrated in the diagram below. As you can see from the example, the 52 week high and low can be quite a large distance apart.

How could you use a stocks 52 week high or a stocks 52 week low in your trading?
There if we are looking at long term trading such as you might do with the 52 week high and low as your signals, there are basically two approaches:
- Trend Trading
- Counter Trend
In the trend trading approach you would enter in the direction of the trend and hope to exit at a better price later. This would mean buying new 52 week highs and shorting new 52 week lows.
In the counter trend approach you would enter in the opposite direction of the trend expecting that the price would pull back from the extreme price level and move in the opposite direction.
Both trend trading and counter trend strategies can be profitable, so we will investigate both in this article. To determine if there is a decent raw edge to work with, we will therefore investigate 4 different entry signals:
- Buy the first new 52 week high in the last 20 weeks
- Short the first new 52 week high in the last 20 weeks
- Buy the first new 52 week low in the last 20 weeks
- Short the first new 52 week low in the last 20 weeks
To make results somewhat realistic, we will include 0.25% commission per side and we will only trade stocks that have an average daily turnover of $1m per day over the last 20 trading days. We will run all tests on Australian ordinary shares.
Testing the raw edge of a stocks 52 week highs and lows
One useful way of evaluating if a trading signal has a potentially profitable edge is to test the profitability of the signal at different time intervals after the signal occurred. For example, lets look at each of the 4 signals listed above, and evaluate the average percentage profit across all stocks after 5 /10 / 50 / 100 days. This is a simple backtest to run using Amibroker that takes just a few seconds (See link at the end of this article to download the code)
The table below shows the average profit per trade (%) across every signal generated from 1990 to 2020 using these simple rules. As you can see, the trend following approaches do have an edge, while the counter trend approaches have a negative edge.
Note however that the edge is present only over the long term. In the shorter term there may be a small edge, but it is quickly eaten up by the commission cost we have included in our backtest.

This means that buying new 52 week lows is likely to be a losing strategy and shorting new 52 week highs is also likely to be a losing strategy because the entry signals have a negative expected profit.
Momentum (trends) are a powerful force in finance, and trading in the direction of the trend is clearly beneficial, especially on the long side as the edge is much more significant for rising stocks than for falling stocks. For the remainder of this article I am going to focus on the long side because the edge is larger and trading long is applicable to more traders as I know many are uncomfortable with shorting.
Backtest a complete trading system using a stocks 52 week highs
Now that we know that buying when a stock makes a new 52 week high has a profitable edge, let’s combine this entry rule with a number of different exits and see if we can make a trading system that has some potential. I want to test different types of exits to see which is the most promising.
Here are some exit ideas that are consistent with buying new 52 week highs:
- Hold until the stock crosses below the 200 day moving average
- Hold until the stock closes below a 25% trailing stop loss
- Hold until the stock makes a new 100 bar lowest close
Running the backtest on weekly bars exiting at the open of the bar after the signal is given gives the following results:

As you can see, all three exits are profitable when combined with the entry on the new 52 week high. These are not terribly exciting strategies, but they are profitable.
This is very interesting because it is directly opposite of what most people would intuitively think. Intuitively most would expect to make money by buying something that is cheap (at or near the 52 week lows) and selling it when it is expensive, but this analysis shows that the opposite is actually true. Buying when something is relatively expensive (at the 52 week high) and selling it when it is relatively cheap (at a new 52 week low) is actually profitable. This is the basis of trend following and this concept can be built into extremely profitable stock trading systems.
Refining the basic 52 week high trend trading strategy with additional filters
I want to show you how some basic filters can improve on a raw edge like the 52 week high trend trading system, to do that we need to start comparing performance of a complete system with compound annual returns. So for the remainder of the article the tests use a 5% of equity position size model so that we can see how well the rules compound and the drawdown they experienced in the past. All backtesting for this investigation is done on daily bars, so a 52 week high has been replaced with a 260 day high (52week x 5 days per week = 260 days)
The base case system buys stocks making a new 52 week highest close and exits them when they cross below the 200 day simple moving average.
Base Case Performance:
- Compound annual return: 8.6%
- Max Historical Drawdown: 44%
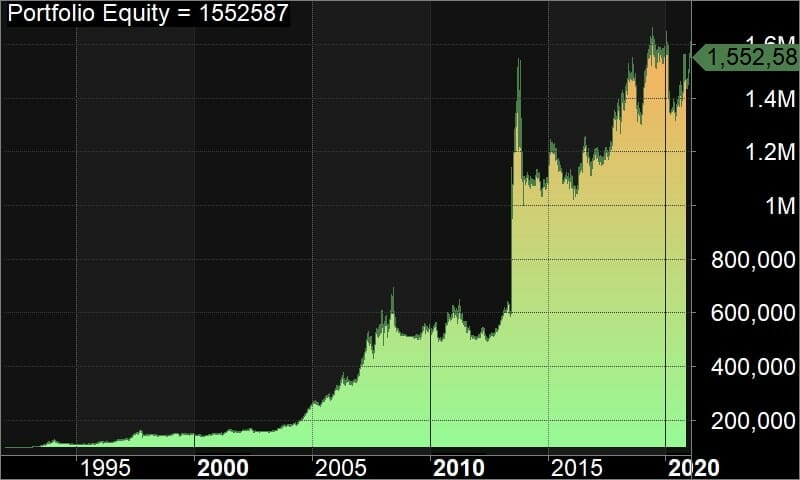
The equity curve (which was produced by backtesting in Amibroker) clearly suffers when the market turns down into a bear market as occurred in 2008, because that is when the largest drawdown occurred. The image below shows the backtested equity curve. Clearly the system gives back way too much profit and struggles to make money in a bear market!

An interesting observation of stock charts I have made is that often lower volatility stocks tend to trend far better than high volatility stocks. This is not always the case with every market or system, but it is worth testing here. Lets filter out stocks who’s Average True Range is more than 5% of the closing price. This will keep our system in lower volatility stocks that have more predictable moves.

Trading only low volatility stocks improves the annual return to 9.8% and reduces the drawdown to 35%. Still not brilliant but looking more promising. The challenge now however, is that the number of trades is still quite low at just 598 over the 30 odd years of the backtest. If we want to increase returns we need to find a way to allow more trades into the backtest.
A useful strategy for backtesting stock trading systems is to look at which rules are constricting system performance. Sometimes we unintentionally limit ourselves by starting out with a faulty assumption or belief. In this case, our system started with an entry rule that said “Buy the stock if it makes a new 52 week high and it is the first 52 week high in 20 weeks (100 days).
After a little offline investigation, I realised that the second part of this rule was really restricting us – because there are just not that many stocks that go sideways for 20 weeks or more and then start trending up. So let’s see what happens if we remove that constraint and just enter on any 52 week (260 day) high. Again, I have backtested this in Amibroker and here is the equity curve:

Now we are getting somewhere! The compound annual return is now 16% and the maximum historical drawdown is 38%. While this is much better than the broader market, it can still be improved further. I have trend following systems that perform much better than this… it just takes time and persistence to identify them.
Conclusion on stocks 52 week highs (Plus a trading system lesson)
It is clear that there is an edge in using the 52 week high as an entry, however it is not what the non-trading public might think. Humans are generally bargain hunters and we are much more likely to want something when it is cheap compared to recent prices we have observed. As we have seen, if we bring this approach into the stock market the results will be disasterous. Finding big edges like this and converting them into profitable trading systems is the quickest way to turn your trading around and start making money in the markets.
The second major lesson that came out of this investigation is that we can make an assumption early on in our trading that really holds us back. In this case the belief that we had to trade a new high only if it was the first new high in a long time was really holding back the system performance. Once we identified and eliminated that flawed assumption the returns from the system almost doubled!
The great thing about trading stocks systematically is you have the ability to quickly and easily test all of your ideas and assumptions using a tool like Amibroker. This will force you to look at all of your tightly held beliefs about the way the markets work and you may just find that some of them are holding you back!
About The Author:
Adrian Reid has over 18 years of trading experience and has been a profitable systematic trader for over 15 years. He trades for a living and spent most of 2019 traveling with his wife and two kids and trading from the road. He is the founder and trading coach at Enlightened Stock Trading where for the last 5 years he has been mentoring stock traders globally.
This article first appeared in Your Trading Edge Magazine in the March 2021 edition.
Do you want to improve your level confidence in your trading rules? Click Here to download the Trading System Confidence Cheat Sheet and receive 4 exclusive training videos for FREE.


