In this article you will learn all about what a stocks 52 week low is, how to trade stocks near 52 week lows, how to manage risks and whether a stocks 52 week low can actually give you an edge in your trading.
The weekly low of a stock is simply the lowest price it has traded at in the last week. Extrapolating this concept, if you want the 52 week low of stock you simply look back 52 weeks on the stock chart and find the lowest price that the stock has traded at in that period.
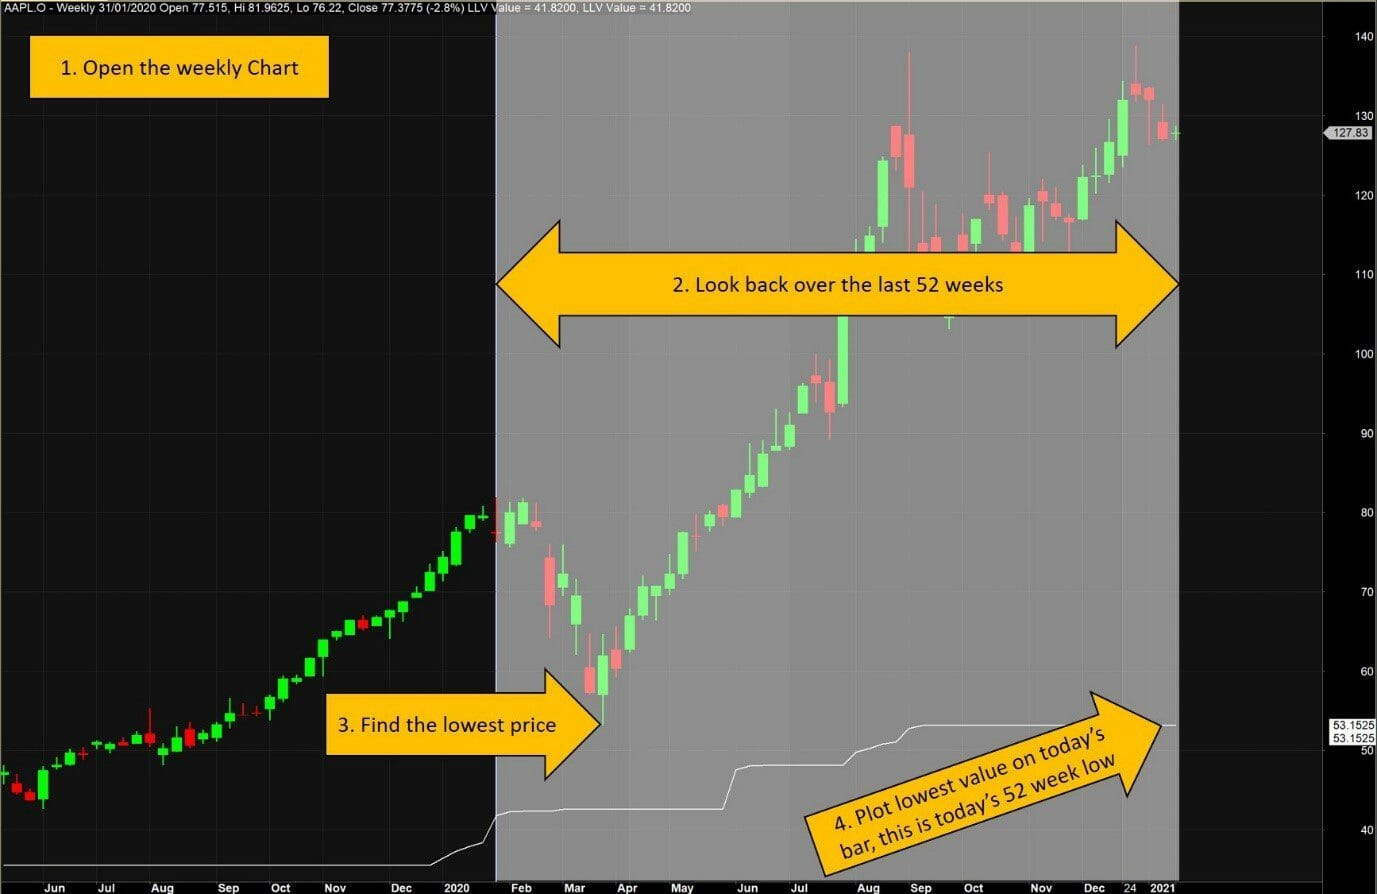
This is illustrated on the diagram below on this stock chart produced using Amibroker:

When you plot the 52 week low as an indicator on charting software such as Amibroker or TradingView, your charting software looks at each weekly bar and finds the lowest price from the 52 weeks leading up to that bar and plots that value as the 52 week low. This is the solid white line on the chart above. In the example above AAPL is a long way above its 52 week low because it is in a strong up trend.
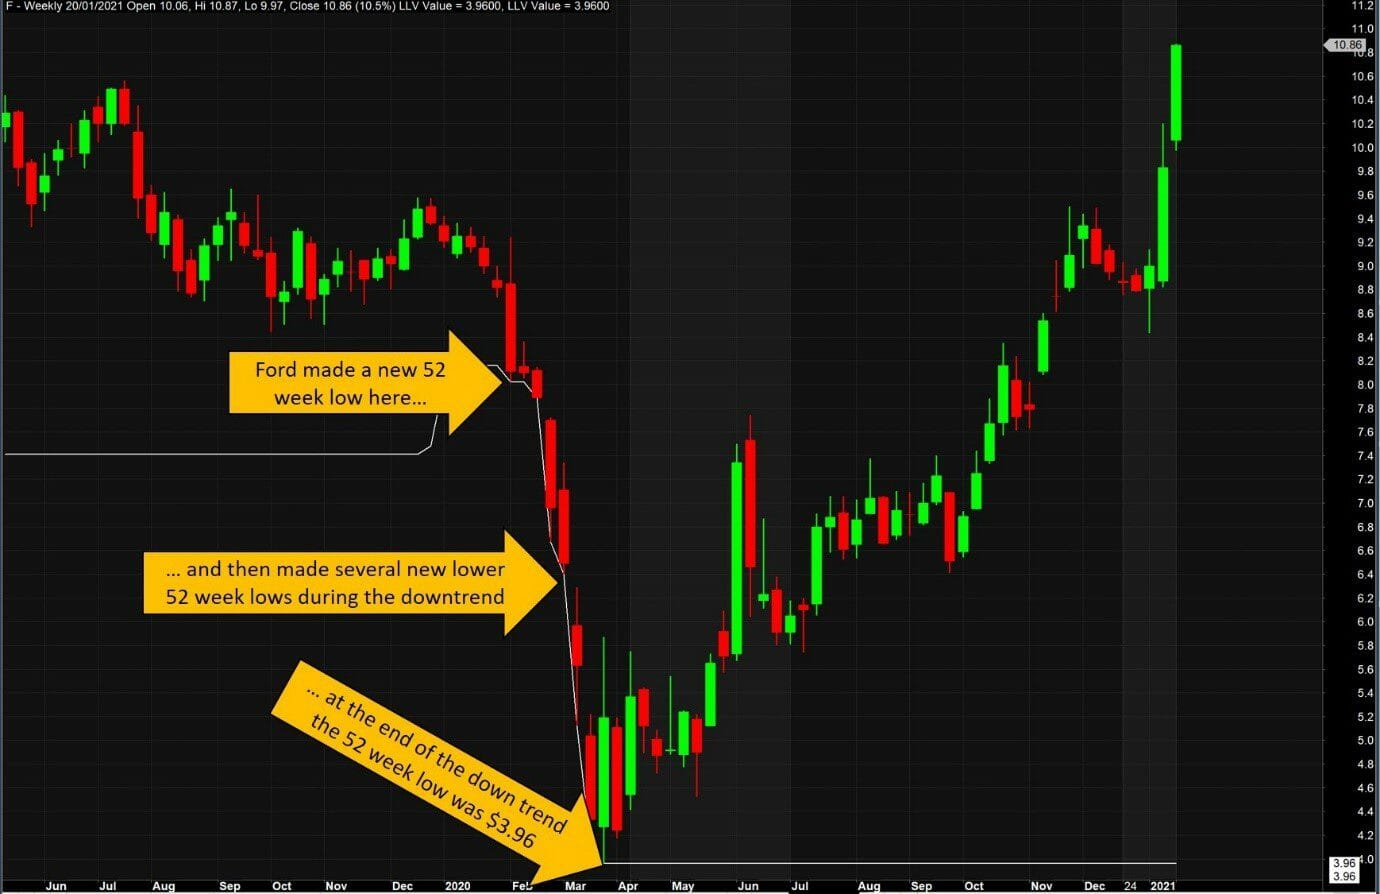
The image below shows how during a downtrend in 2020, Ford (F) made a new 52 week low towards the start of the downtrend and then made several more new 52 week lows as the downtrend progressed.

Once the downtrend ended the stock price started rising but the 52 week low remained flat because that was still the lowest price the stock traded at in the last year.
What are stocks with 52 week low
What do we mean by “stocks with 52 week low”? Usually when people scan for a list of stocks with 52 week low, they are looking for stocks where THIS WEEK, the stock made the lowest price it has had out of any time in the last 52 weeks.
How to trade stocks near 52 week low
The typical temptation when looking at a chart of a stock near the 52 week low is to assume the stock is cheap, and therefore is at a bargain price to add to your portfolio. It is all too easy to compare the current price at the stocks 52 week low and compare it to the historically higher prices and start dreaming of the windfall profits that could come to us if the stock returns to those highs.
This is a common instinct because we are comparing the current price (near the 52 week low) to the recent past when the price was higher. This makes the current price feel like a bargain and as we buy we expect the whole market to have the same realization about this amazing bargain and for the stock price to immediately soar back to previous higher prices… making us rich in the process.
We have all had these thoughts right?
But to make money trading we need to be sure we have a trading edge. The best way to do this is to create a complete set of rules to guide your trading (a trading system) and backtest them on historical data.
In this section I will backtest some ideas to understand what strategies could be profitable for stocks near 52 week lows. Each of these backtests is done with Amibroker and makes the following assumptions:
- Buy if today if the stock makes a 52 week low
- Start with $100,000 initial equity
- Only trade stocks that traded more than $2,500,000 per week on average over the past 5 weeks for liquidity
- Only trade ordinary stocks listed US stocks on the main exchanges (no OTC stocks)
- 25% per trade for slippage and commission
- Put 5% of equity into each trade
- Place an initial stop loss 25% below entry price to give the trade room to move but also protect our account
- Backtest on weekly charts with entries and exits at the following Monday’s open
- Test the strategy from 1990 – 2020
We will try various exit techniques to see if we can find a profitable method for trading stocks near the 52 week low:
- Exit after 6 months unless the stop loss is hit
- Exit after 1 year unless the stop loss is hit
- Exit the next bar at the open if the stock closes below the 20% trailing stop
- Exit with a 50% profit target
- Exit when the stock makes a new 26 week high
The equity curves below show the bactested performance of these stock trading systems over the last 30 years. These backtests were all generated using Amibroker.
Exit after 6 months unless the stop loss is hit

The Amibroker Formula Language code for this system is:
// Time Frame: Weekly
// Direction: Long only
// Backtest Setup
SetOption(“InitialEquity”, 100000); // Adjust this to match your starting equity
SetOption(“MaxOpenPositions”,10000); // Use this to limit the maximum number of trades
SetOption(“AccountMargin”, 100); // Adjust the level of leverage here.
// 100 = No Leverage, 50 = Up to $2 exposure for every $1 of equity
SetOption(“usecustombacktestproc”, False);
SetOption(“CommissionMode”,1); // Set the commissions to Mode 1 – percent of trade
SetOption(“CommissionAmount”, 0.25); // Set commission amount here to match the commission mode you select above
SetBacktestMode(backtestRegular);
SetTradeDelays(1,1,1,1); // Trades are delayed by 1 bar. Signals executed on the next bar after the signal
BuyPrice = Open; // Buy stocks at the open of the bar following the signal
SellPrice = Open; // Sell stocks at the open of the bar following the signal
Short=Cover=0;
// Trading Rules (Entry)
LiquidityFilter = EMA(C*V,5) > 2500000; // Require meaningful turnover each trading week
Buy = LiquidityFilter AND L==LLV(L,52) AND StrFind( FullName(),” ORD”);
// Trading Rules (Exit)
Sell = 0;
ApplyStop(stopTypeNBar,stopModeBars,26,1); // Exit after 26 weeks (1/2 year)
// Position Sizing & Risk Management
SetPositionSize(5,spsPercentOfEquity); // The position size model is % of Equity per trade
ApplyStop(stopTypeLoss,stopModePercent,25,2,False);
// Exit the position on the next bar at the open if the 25% initial stop loss is touched intra-week
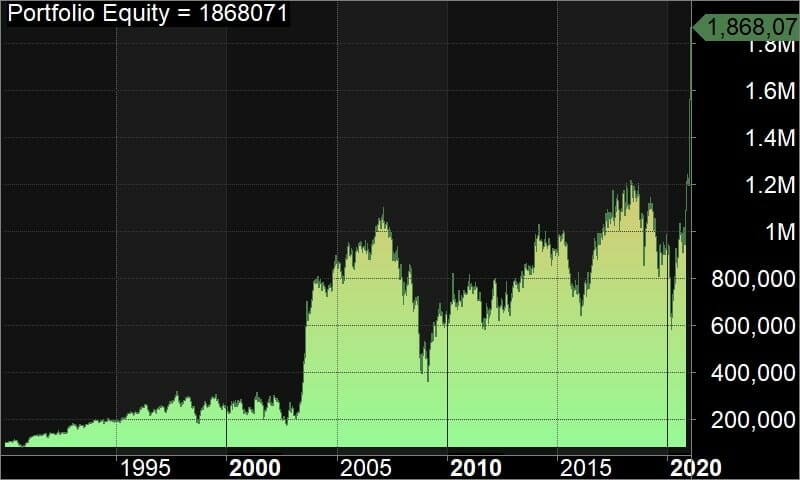
Compound Annual Return: 9.86%
Maximum Historical Drawdown: -67.23%
After backtesting with Amibroker we can see that while entering trades on a 52 week low and exiting after 6 months is profitable, the return is less than 10% pa and the maximum historical drawdown is very high. There is a lot of trading activity using these rules for very little profitability. In fact you would be much better off just buying and holding an index fund. This backtested equity curve is very erratic and is not worth pursuing further in my view.
Exit after 1 year unless the stop loss is hit

Compound Annual Return: 8.84%
Maximum Historical Drawdown: -67.26%
Backtesting the same rules as above except holding each trade for 1 year produces a similarly unattractive equity curve as the 6 month hold period. The return is less than 10% pa and the drawdown is still unacceptable at 67%. Clearly entering stocks making new 52 week lows and holding for 6-12 months is not an attractive stock trading strategy.
Exit the next bar at the open if the stock closes below the 30% trailing stop

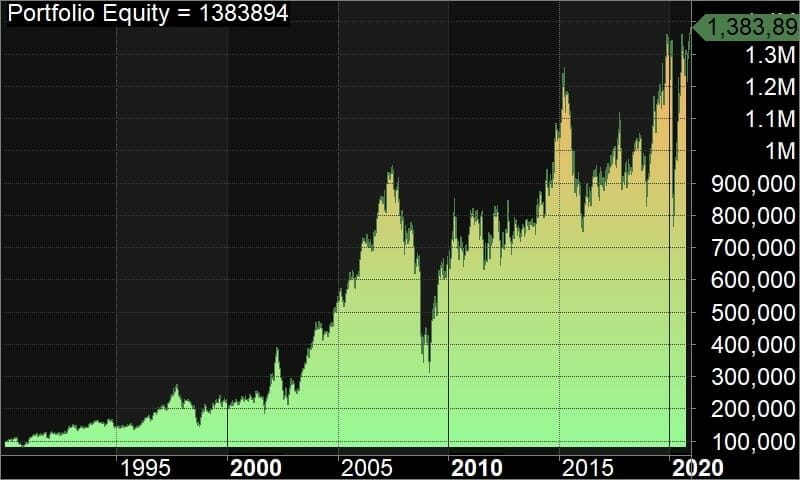
Compound Annual Return: 14.59%
Maximum Historical Drawdown: -59.28%
When we add a more structured exit to the system we start to get better results. Entering on the 52 week low and then exiting if the stock closes below the 30% trailing stop for the week improves the returns to a more respectable 14.59% pa, however the maximum drawdown is still very high at almost 60%. This approach certainly beats the broader market but can still be improved upon.
As you can see from the backtests that I ran in Amibroker, entering on a 52 week low can be profitable, but it is most likely a pretty marginal entry signal. Lets investigate the risks and advantages of trading stocks near 52 week low
Risks of trading stocks near 52 week low
The challenge you face when buying stocks near 52 week low prices is that they are in a downtrend. This is true by definition because in order for this week’s price to be a new 52 week low it has to be trading at the lowest price it has traded over the last 52 weeks.
One of the most common sayings in trading is “The trend is your friend” however when you buy a stock at or near the 52 week lows, the trend is working against you because you will only profit if the trend turns and the stock starts going up. The risk of trading stocks near 52 week lows is the downtrend will continue and your position will move dramatically against you. It is a much more profitable strategy to buy in the direction of the primary trend, however tempting it is to buy cheap stocks near 52 week lows.
Another common piece of trading wisdom is “Don’t catch a falling knife”. This is really what you are trying to do by buying stocks near 52 week lows. When you enter at a long term low like this in what is usually an established downtrend, you are hoping that the knife has stopped falling and is about to turn around. The very large drawdown that all of the strategies above experience suggests that frequently the knife keeps falling well past the initial 52 week low.
Do stocks near 52 week low outperform the market?
While the backtests we have run in this article are not exhaustive, they do imply that there is not a great advantage to buying stocks near 52 week lows. The returns from these stocks are not as good as many other simple trend following systems can achieve in stocks. There certainly may be individual exceptions from time to time, however as a general principle, because momentum tends to persist, I would not expect stocks at or near their 52 week lows to out perform the market.
Managing risk when buying stocks at the 52 week low
Despite the mediocre backtest results presented above, if you do buy stocks at 52 week low, then make sure you are well diversified and use a stop loss to get you out in case the stock does not turn around as you anticipate. You should only risk a very small percentage of your account on each trade so that when you are wrong many times in a row (which you could be when you enter stocks near 52 week lows), you don’t lose too much money.
Better yet – I would encourage you to realise that buying stocks that look cheap at 52 week lows is a losers game. Rather than throw money away buying stocks that look cheap (but will probably get cheaper), adopt a solid trend trading system instead and you will make a lot more money with much lower drawdown.


Share This
Share this post with your friends!