Have you ever discovered that something you believed with all your being was WRONG… or at least not as right as you thought?
I had one of these experiences today when working on a trading system for one of my students. I realized that one aspect of the system that I always use just wasn’t helping… so I took it out and BOOM performance improved dramatically!
I use Amibroker software to backtest most of my trading systems. It is also what I recommend to students in my Enlightened Stock Trader Certification Program because it is a fantastic piece of software and it is amazingly powerful given it’s low price. I was working with Amibroker this week…to improve a trading system for one of my clients when I DISCOVERED THAT ONE OF MY CORE TRADING ASSUMPTIONS WAS WRONG!
Like many trading systems that remain profitable for decades, this system was a trend following system which trades the US Stock Market. I can’t disclose the exact rules because that would not be fair to my client, however I have included some code snippets below to bring this to life a bit for you if you are an Amibroker user.
- Markets: All US Stocks (Divided into in sample and out of sample groups)
- Backtest Period: Jan 1993 – Jan 2018
- Leverage: None
- Trade Execution: Next bar on the open
- Commissions: $0.005 per share
- Risk per trade: 0.5% of account risk per trade
- Stop Loss: 3 times yesterday’s average true range (ATR)
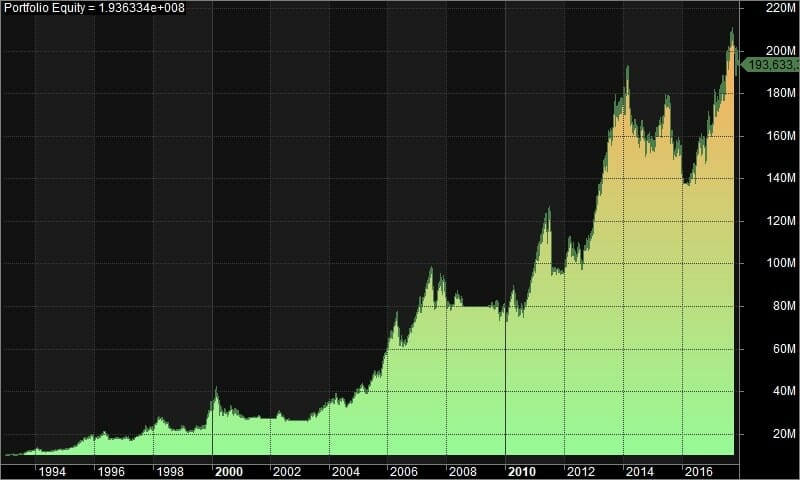
Original backtest equity curve from the trend following trading system. Produced using Amibroker and Metastock historical data
This backtest shows a CAR/MDD (Compound Annual Return / Maximum Drawdown) of 0.33. This is not great, but it is a 25 year backtest with minimal optimization after all. It is also enough to well and truly beat buy and hold with lower drawdown than the market over the same period…but I wanted to improve this and reduce the drawdown even further.
The first step I usually take to improve any system is to vary all of the parameters +/- 20% or so and see which parameters the system performance is most sensitive to. When I did this I found a few interesting things, but the MOST INTERESTING one was that the smoothness of the equity curve was quite sensitive to the width of the initial stop loss.
Here is the code that was used for the initial stop loss:
Amibroker Code for the Initial Stop Loss:
RiskPerShare = 3*Ref(ATR(14),-1);
//The stop loss width is 3 times the previous day’s Average True RangeApplyStop(stopTypeLoss, stopModePoint, RiskPerShare, 1, False );
//Using Amibroker’s built in Applystop function, the initial stop loss is fixed at trade entry date and placed in the market//Position Sizing Model:
PositionRisk = Optimize(“Percent Risk Per Trade”,0.5,0.25,2.00,0.25);
//This allows you to optimize the risk per trade from 0.25% to 2% in steps of 0.25%
PercentSize = PositionRisk * BuyPrice / RiskPerShare;
SetPositionSize( PercentSize, spsPercentOfEquity );
The first thing that I found was that if I left everything else the same but widened the initial stop loss the equity curve became smoother. I widened the initial stop loss from 3 times the Average True Range to 6 times the ATR. When I made this change the average profit per trade dropped, BUT the equity curve was significantly smoother. This is shown in the image below.
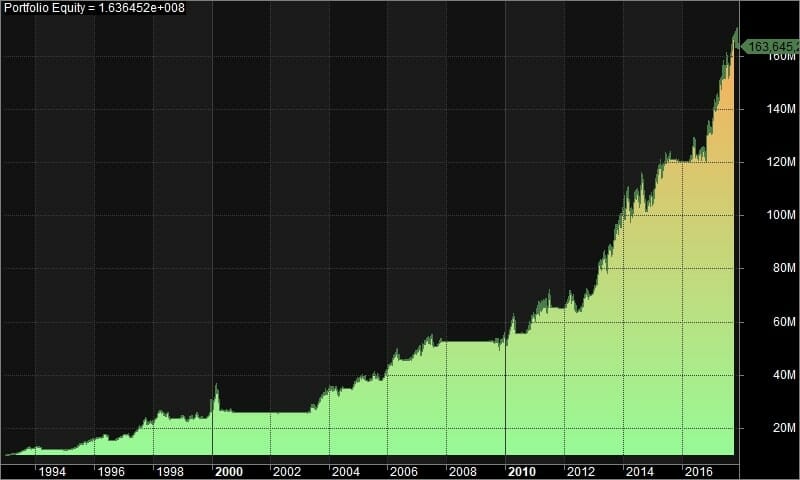
Modified backtest equity curve from the trend following trading system with a wider initial stop loss (6 time Average True Range). Produced using Amibroker
This backtest shows a CAR/MDD (Compound Annual Return / Maximum Drawdown) of 0.39. This may not sound like a huge improvement, but just look at the equity curve and compare it to the equity curve from the first backtest above. The equity curve is significantly smoother because of the wider initial stop loss. Note that the total profits are similar but the drawdown is significantly reduced.
I pushed this a little further and widened the stop loss to 8 times the Average True Range. This is the result:

Modified backtest equity curve from trend following trading system with even wider initial stop loss – 8 times the Average True Range – Produced using Amibroker
This backtest shows a CAR/MDD (Compound Annual Return / Maximum Drawdown) of 0.45. This is now starting to look a lot better! So the much wider initial stop loss gives a much smoother equity curve in this example than the tight initial stop loss that we started with.
So the obvious question is, “What does the system look like with no stop loss at all?”
Well I am glad you asked…I removed the initial stop loss entirely and changed the position sizing model from a 0.5% risk per trade which I used for the previous three charts…I changed the system to rely only on the trend following indicator exit and used a 5% of equity position sizing model. This model takes 5% of your equity and buys as many shares in the stock as it can with that amount of money. The code for this position sizing model in Amibroker is:
SetPositionSize( 5, spsPercentOfEquity );
OR if you want to optimize the percent of equity per trade then you would use the following:
SetPositionSize( Optimize(“Percent of equity per trade”,5,1,10,0.5), spsPercentOfEquity );
// When you use this in Amibroker and run an optimization it will step the percent of equity from 1% to 10% in steps of 0.5%
Guess What?
That’s right! The equity curve improved even more when the stop loss was removed all together!
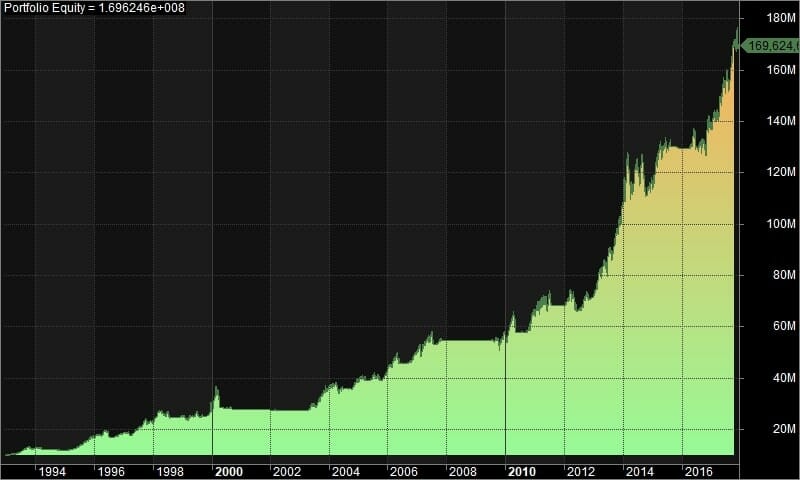
Modified backtest equity curve from the trend following trading system with no stop loss – Produced using Amibroker
I didn’t do any optimization of the position size, but just removing the initial stop loss smoothed the equity curve even further and increased the CAR/MDD to 0.49!
Implications, Conclusions and a Warning
In this example we have improved the performance of a trend following stock trading system by removing the initial stop loss and relying only on the trend following exit rule to get out of losing trades. This also meant that we had to change the position sizing model from a % risk per trade to a % or equity position sizing model (because we no longer had a stop loss to fix the risk on each trade…although there are ways around this but it is beyond the scope of this post)
We were able to improve the Compound Annual Return/Maximum Drawdown from 0.33 to 0.49 simply by removing the stop loss!!!
The implication for me is that (yet again) I am reminded to validate every one of my assumptions about trading. The ‘truth’ that every stock trading system should have a stoploss is not as true as I thought it was. So whenever you are designing and testing your trading systems the lesson is to be mindful of what you are assuming is true. If you have not tested it objectively with a backtest then you may be making a costly mistake.
Now for the warning…I believe that stop losses have a purpose and immense value. The value is that they save you from losing too much money on any one trade. If you lack the discipline to check your exit signals every single day, then using an in market stop loss really saves your butt when things go wrong.
So please don’t just go out and remove all of your stop losses. Instead, crack open your backtester and test the idea for yourself. See how it impacts your trading system.
Now for the opportunity…
If this all sounds really interesting but you either don’t have a trading system or you don’t know how to backtest your trading system then consider joining The Trader Success System. In this program you will learn how to design and backtest your own stock trading system that fits your personality, objectives and lifestyle. By the end of the program you will have your own Amibroker trading system and you will know how to properly test all of your trading ideas in the future!
That means you will be a fully independent stock trader – Imagine how you will feel when you no longer have to HOPE your strategy will work or HOPE that the newsletter you subscribe to will give you good trade calls…Imagine how you will feel when you have CONFIDENCE that your system works!
If that sounds like what you need then please click the button below to learn more about The Trader Success System – It will change your trading forever and give you the confidence you need to succeed in the markets for decades…
A Bit About Me…
In case you are new to Enlightened Stock Trading, I have been trading for more than 15 years now, and the major turning point that enabled me to become consistently profitable trading the stock market was when I discovered systematic stock trading. Before I started using stock trading systems to make my decisions I used many different indicators and made my buy and sell decisions on a discretionary basis…the results of this were very inconsistent and ultimately I lost money.
So the big turning point came when I discovered systematic stock trading and was finally able to test my ideas and find out objectively if they were profitable or not. Of course I immediately discovered that many of my trading ideas were not profitable. I buried myself in trading system development for several months and when I emerged I had a trading system that has now made me money for over 13 years! I have made a few small modifications along the way, but I still trade essentially the same stock trading system (plus a number of other systems as well)
Anyway – enough of the history lesson…If you are even a little curious and you really want to take control of your stock trading by learning to backtest your ideas and develop your own trading systems then click this link and join The Trader Success System Today!






Adrian doesn’t disclose the details, but just from a quick look at the equity curve i think we can deduce a few things. Firstly it looks like a Trend Following (TF) system, probably Long Only, and using an Index filter. Is that right ? One of the nice things about TF systems is that (unlike some other types of trading systems) they tend to be “self correcting”. In other words, the system logic that gets you INTO the trade will probably also get you OUT of the trade just like a stop would if the trend reverses too far. So a well designed TF trading system logic will probably perform a similar function to a Stop Loss (SL) of some width. Now as beginners we are told to “ALWAYS” use a SL to protect us, but actually for a good TF system with well designed trade logic, it may not be necessary and in fact can be counter-productive. An SL that is too tight will be almost guaranteed to be hit and thereby will LOCK-IN THE LOSSES!!, whereas an SL that is very loose is almost the same as no SL at all. It looks like Adrian’s system here must have sufficiently good trade logic that the logical exits work better than the original SL, which can therefore be dispensed with in this case.
Tony thank you for your very insightful comments, as always you are right on the money here – well done.
Adrian