We’ll talk about systematic trading, which is the perfect workflow for busy independent traders. Before we get into that, have you ever asked yourself questions like this?
- When you think about your trading, is this setup profitable?
- Should I move my stop up? Should I have stopped?
- Should I set my stop to break even?
- How much money should I risk on this trade?
- Should I take profits here, or should I wait?
- Which indicator gives me the best signals?
- How big could the drawdown get when I’m following this trading strategy?
- What returns could I even achieve?
There are only two types of traders:
- Traders that ask these questions listed above
- Traders who know how to quickly find the answers to all of those questions and more for themselves
My goal is to show you the path to becoming a fully self-empowered trader who can objectively answer questions about the markets for yourself. The way you do that is by trading and backtesting systematically. It doesn’t matter whether you’re in stocks, futures, or Forex. The systematic approach is how you get past those questions and empower yourself to provide and finally answers for yourself.
I’ve been a private trader for over 18 years now and have been profitable and systematic for 15 years. At the beginning and throughout my journey, I’ve read over 200 books on trading and stock trading, and I escaped the corporate world in 2012. In that year, in 2012, I made more money trading for half an hour a day or less following my systems than I did working 12 to 14 hours a day in my day job. At that point, the corporate world no longer made sense to me. I left to pursue being an independent trader, and I’ve never looked back. Over that journey, I paid off all my debts as a result of trading. I paid off the house mortgage and everything like that to live completely debt-free and build a seven-figure trading account, and now we support ourselves, our family, using our trading.
Today, I coach and mentor traders from all over the world in the principles of systematic trading and how to develop and backtest trading systems to be profitable. It will work for you no matter what market you’re in. Whether you trade US, Australian, Asian, or European markets, it doesn’t matter. The great thing about learning about systematic trading is that you take those principles and apply them to any market anywhere in the world.
Why Do I Teach And Help People?
When I left the corporate world in 2012, I was finally free, trading from home. That was great. I had complete control over my life, but I very quickly found that I was alone. All of my friends were at work, none of my friends were financially free, and I was isolated. Frankly, I didn’t know a single trader and didn’t have any other traders in my life. I started teaching trading because I knew people needed to know. People were interested, they just weren’t doing it well yet, or they just didn’t know how to start.
I started teaching trading to build a community of traders around me to help them grow by teaching, or I could grow because I’m a firm believer in the concept that unless you have been able to teach something successfully, you don’t truly know it. When I’ve taken a student from knowing absolutely nothing through to being profitable and systematic, and then seeing those students grow their account. I have no one student who started and never looked at a stock chart before when she started with me. She’s been through the whole journey, gone systematic, and her account has grown tenfold since we started working together.
That sort of feedback and result is really exciting for me, particularly because there are so many scams and so much misinformation out there. My mission is to empower traders to make money on their own. By empowering traders and giving them the tools to answer the questions that they need to answer themselves, not having to have blind faith in me or some other guru to say this is the best indicator, or this is the best system, or this is the stock that’s going to make you rich because none of that stuff works. The only thing that works is when you’re empowered as a trader to make the decisions, find answers, and build confidence in your profitability.
That’s why I teach, to give that and to share that gift. Frankly, that’s what I feel my time with them is really exciting.
What Are The Common Problems That Traders Face?
There are 6 common problems that all traders face:
1. Information Overload
What I realized over this journey is that most traders face the same problems. The problems are these; there’s information overload. If you research about trading, how to make money, or which stock is the best, you’ll get millions of web pages trying to share information and insight. As a trader, the challenge is you’re trying to learn how do you sift through all of that? How do you choose which approach is right? We’re all overloaded with information, and what you need to succeed is a step-by-step process to cut through all of that, give you exactly what you need, and come out the other end profitable and systematic. You’ll see why being systematic is the answer.

2. Conflicting Information

The second problem is conflicting information. How many times have you looked at a newspaper, read one article, and it’s positive? Then you read the following article, and the world is coming to an end? It’s happened all of the time. You look at one indicator, and it’s flashing buy signals, and you look at another indicator, and it’s flashing sell signals. Conflicting information is a real challenge that traders face. We need a path through that to make decisions consistently and with competence, and systematic trading gives that answer.
3. Time
The next problem we all face, and it’s systemic across the whole world, is time. Life is hectic, and time is one of the number one objections I see after talking to hundreds and hundreds of traders. I’m so busy, and I don’t have the time to do the work, so you need a systematic approach that reduces the daily time required to fit it in with your life and still make money.

4. Inconsistency
The next challenge that traders face is inconsistency, which holds people back. It holds traders back from being profitable because if you don’t make decisions the same way every single time, it’s hard to know what you’re doing right or wrong. One day you’re looking at MACD, the next day, you’re looking at stochastics, and the next day you’re looking at moving averages, and then you’re looking at divergence. Now you’re trading with trend lines and now using support and resistance or Fibonacci or whatever. Unless you have a consistent approach that you’re following each time you make your decisions, it’s hard to refine and improve. It is precisely what I was suffering with, struggling with the first three years of my trading until I found trading systems to be my answer> Inconsistency.
5. Emotion
Then there’s also obviously the emotion because we’re dealing with money. When it comes to money, human beings are funny things. We get fearful about losing it, we get greedy about making it, we get egotistical and full of ourselves when we make a lot of it, and then we start making mistakes, and we lose all of it. The emotional impact of participating in the financial markets of trading is very high, and you can’t underestimate it because most people are not trained. We’re certainly not taught in school to manage and deal with money, so the emotional swings we feel as our accounts and trades go up and down are immense, and we need a method to get over that, to get past and move through it to profitability.
When our emotion is high, our intelligence is low, and we don’t make good financial decisions. Emotions are one of the enormous challenges that traders face. Again, systematic trading helps you get through that.

6. Insufficient Data
One of the challenges that traders face that probably fewer are aware of is insufficient data. Think about how most people trade. Let’s say you read a magazine or a book, and you set up and like the look of it. What do you do? You put that set up on your chart, look at many stocks, and find a few examples of that setup working. Maybe you see five or ten trade examples using that setup, and you satisfy yourself.
It’s a profitable and good setup. If you’re disciplined, maybe you look at 30 to 50 charts, and you find some examples of wins and some examples of losses, and you analyze the profitability of those signals over 30 to 50 trades. But frankly, I don’t know many people that have done that even. But I want to show you a little example here that demonstrates why that is insufficient and why most traders don’t have enough information to know if they’re profitable. What I’ve got here is a random sample of 10 trades from four different systems.
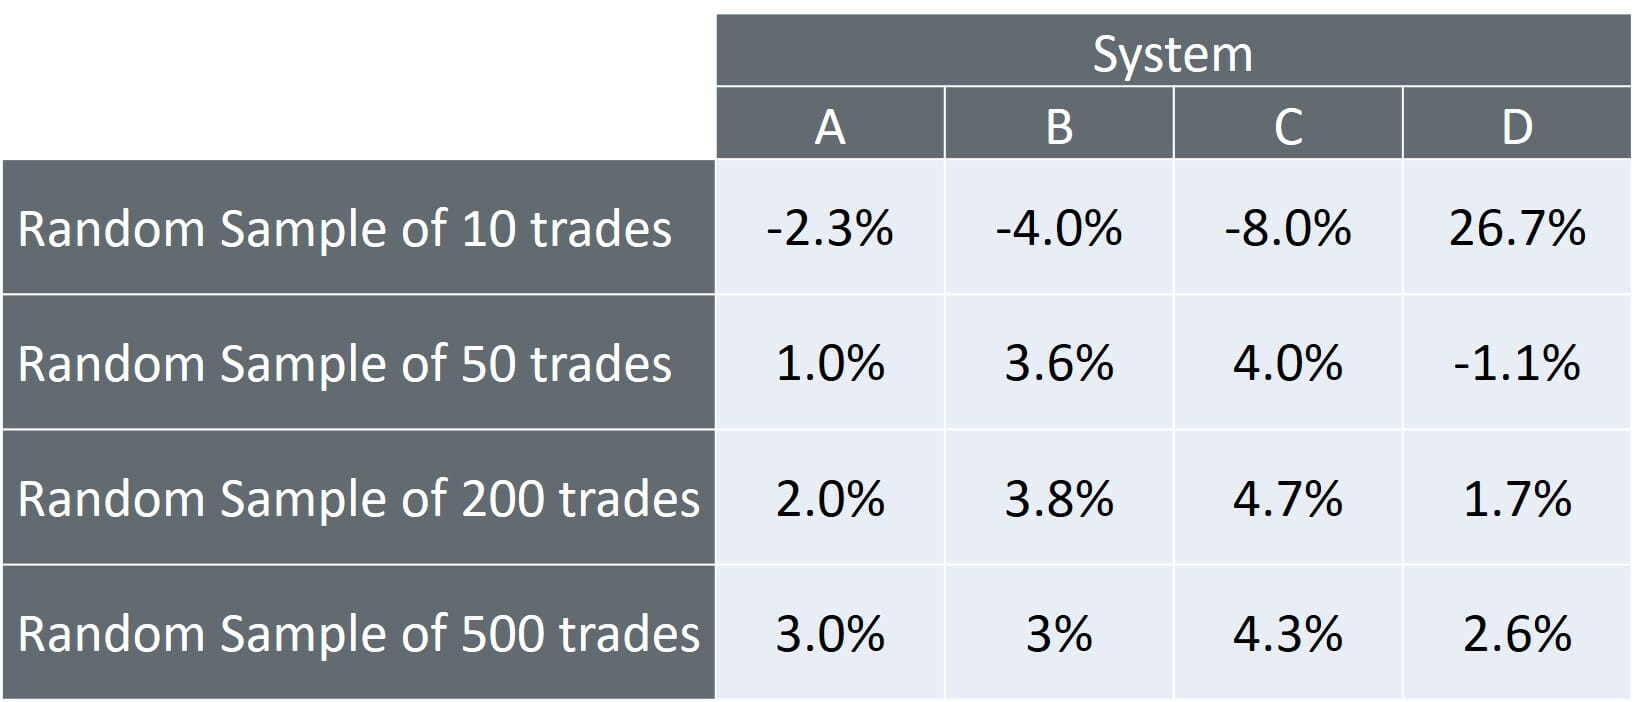
I’ve got four systems and trading approaches and randomly sampled ten trades. System A lost 2.3% on average per trade, system B lost 4% per trade, system C lost 8% on average per trade, and system D made 26.7% on average per trade for those ten trades. Which system is the best? Well, the first three lost money. System D is the best system. I want to trade system D, right? Perfectly logical. But that’s ten trades. Let’s take the same trading approaches. Instead, let’s sample 50 trades and see what happens. We’ve tested 50 trades now and the same systems. What is the average profitability of those trades?
System A made 1% on average, system B made 3.6% on average, system C made 4%, and system D lost 1.1%. All of a sudden, system D is not looking so good. What changed? Nothing changed. It’s precisely the same rules, the same setup, and the same exit. All we’ve done is putting more trades into the sample. You see that going from 10 trades to 50 trades, and the average profitability has shifted dramatically. What does that tell us? An example of 10 trades doesn’t tell us very much about the system’s profitability. Let’s take this a little bit further.
Let’s sample 200 trades from the same four systems. So how does it look now? System A made 2%, B made 3.8%, C made 4.7%, and D made 1.1%. D now looks profitable, but system C is the best. System C is the system you want to trade, right? Let’s take it a little further, push down and make a bigger sample set, and randomly sample 500 trades. Can you imagine sampling 500 trades or 500 examples of your setup in entry and exit on a chart manually? That is a tremendous amount of work that very few people are willing to do. But for these 500 trades, you can see that the average profitability of the systems changed from 200 to 500 even.
It tells you that 200 trades isn’t enough data to understand the system’s profitability properly. Even when you got to 500 trades, the numbers and averages are still moving around a bit. If you want to know how good your approach is, you need a lot of trades in your sample size to understand the profitability better. Now here’s the twist, all of those trades, all four systems, it’s one system. All I’ve done is take different samples of trades from one trading approach. What does this demonstrate? It demonstrates that you need a lot of data to understand the profitability.
If you just sample 10 up to 50 trades on the charts to understand your profitability, you have almost zero knowledge about whether that approach is profitable.
When you’re trading systematically, you can sample hundreds of thousands of trades and get a much higher level of confidence understanding about how well you’re set up in entry and exit perform, and that’s one of the main advantages for going systematic. You can test and build more confidence in your approach because you can get more data. Unless you sample hundreds of thousands of trades, it’s almost impossible to truly understand your approach’s profitability.
You might start trading with a nice setup that looks good, and you might make money for a couple of trades, and then all of a sudden, the markets taking it all away, and you’re sitting in a massive drawdown, and you don’t know why. The reason is, your approach wasn’t profitable in the first place. You were just fooled by the positive results from a tiny sample, so how do we get past that? The solution is to eliminate all of those issues, all of those things that hold most traders back, and the way we do that is by using backtested trading systems. You might be asking yourself, what is a trading system anyway? That sounds complicated and fancy. Maybe you’re worried about how challenging that might be. But let me reassure you, a trading system is a straightforward thing.
What is a trading system?
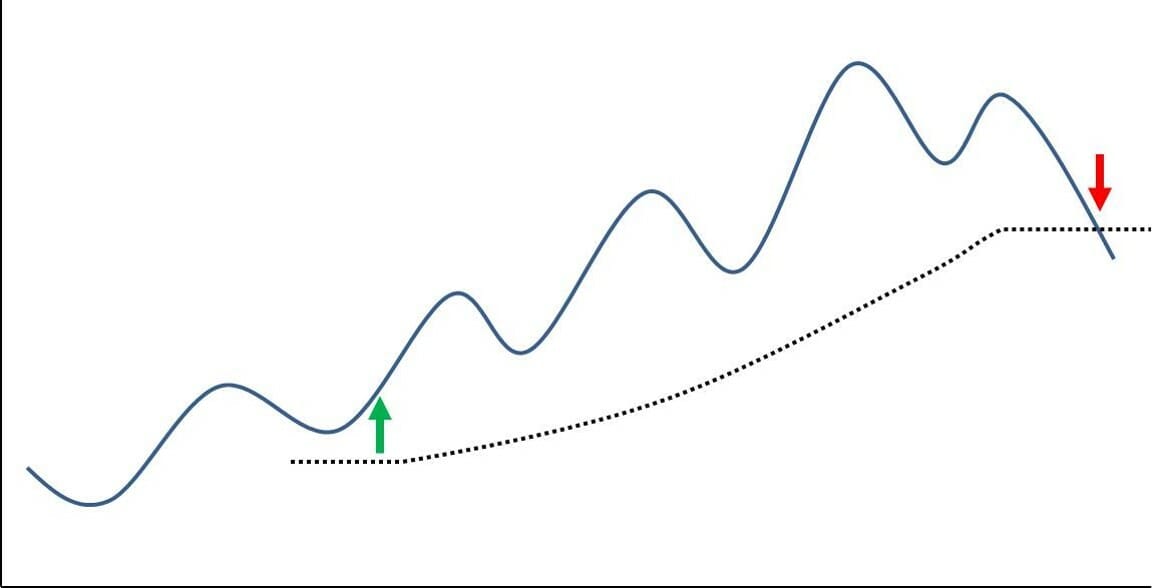
The trading system is just a set of rules. It tells you exactly what to buy, when, how much to buy, and when to sell. It’s like this. If A and B and C are true, you buy this much. If D or A is true, sell. It’s objective rules that define exactly how you move in and out of the market.
What’s in a trading system?
Well, at its core, a trading system contains a couple of things:
- The conditions you will consider taking a trade.
- Entry trigger. The precise moment you want to buy each instrument. It’s like the crossover, indicator signal, or breakout that causes you to buy or sell if you’re going short.
- Exit rule. When you’re going to sell.
- Initial stop loss. There may also be pyramiding rules that you can add to your position as it goes in your favour.
- The risk management rules and the position sizing rules.

The trading system is a set of rules, which are entirely objective, which define exactly when you get in and get out of the market. It does not have it touched the trendline and bounced off. Or did it hit support yet, or should I wait a little longer? It’s not. Is this a divergence? Should I buy it? It’s 100% objective.
Your rules are 100% objective because you can write them in a way that a computer can understand. That’s the beauty of a trading system. You can do that when you have your rules 100% objective like that, you can test them, and you can test them over a lot of data to build that confidence.
What are the advantages of having a trading system?
✔It shortens the learning curve
You don’t have to spend months or years trading, approach and refining it, and getting better at all of the analytics for the method because you design a trading system, which doesn’t take that long once you know how to do it, and then you follow the system. Assuming your system is profitable, you’ll make money over time when you follow the system.
✔Improved diversification
I had this ongoing challenge with my father when he was alive and invested, and he never went systematically. I couldn’t convince him. He just loved the fundamental side of it. He would build his portfolio and talk to me about his results, and I would trade my system and tell him about his results. One of the stark differences, apart from the fact that I’m massively outperformed and had much less drawdown here, was that I was able to diversify far more. When you follow a system, you don’t need to do all of the analytics, all of the reading, and all of the research on every single position because all you do is scan the market to find the trades that meet your criteria, buy them, and when they meet your sell criteria, you sell them.
I can easily manage 20 up to 70 positions in my portfolio. Whereas if you’re making more subjective discretionary trading approaches, you can’t do that because you can’t stay on top of the analytics. Systematic trading allows you to diversify far more than you otherwise would. It also bypasses the emotions because all you’re doing is following the rules. The system is making the decision, making money or losing money at that moment. You can separate yourself from the emotions far more quickly and trade systematically. I noticed my mind was intensely calm.
✔Bypasses Emotions
There are no ups and downs and no stress, frustration, or worry because my job as the trader is to follow the system, and the money will take care of itself. It eliminates trade by trade decisions and uncertainty. There’s no more agonizing over:
- Is this a good trade?
- Do I like this setup?
- Will the news affect this?
- Is the economic condition suitable for the stock?
You don’t have any of that because you’re just following the system. It finally makes your trading repeatable because of the system and objective rules. You do the same thing every single time.
✔Eliminates Trade by Trade Decisions & Uncertainty
Doing that eliminates the instability, randomness, and inconsistency in your trading, allowing you to get profitable far more quickly. You’re following your process. It eliminates the overwhelm because you stop most of that information flow. I don’t read news, watch the TV, browse the internet looking for economic conditions, I just follow the system rules, and having that much more low inflammation diet allows me to trade with a clear head, follow the system and make money consistently no matter what.
- Reduces the time required to do your trading
I can efficiently run a seven-figure portfolio for 10 to 30 minutes a day or less. Just because you grow your account doesn’t mean you have to spend more and more time trading. There are advantages of systematic trading.
What do you need to run systematic trading?
We only need four things:
1. Laptop
You don’t need a server and six different monitors and a real-time data feed and all of that. I’ll get into all the things you don’t need later. The key is that I run my entire training business on my laptop, wherever I am in the world. If you want to be free and you want to travel, then you’ve got to be able to take your trading with you. To build an approach that allows you to do that,
2. Stock market history
You’re going to be testing your ideas and rules. You need all the historical stock price charts to do that. The great thing about my approach is that you’re only using end-of-day data, which is super cheap. It only costs about $30 a month to buy and subscribe to dozens of exchanges and get all of those stocks’ historical data. The costs to run a systematic trading approach are very low.
3. Trading software
I use and recommend Amibroker, and you need this software to run your backtest, analyze your performance, and run your scans each day.
4. Broker
It’s very straightforward. I don’t want you to come away with the impression that systematic trading is complex or has substantial entry barriers. There’s not.
What you don’t need in systematic trading?
❌Complex computing infrastructure.
❌Local server or a virtual server in the cloud.
❌Six computer monitors.
❌A Computer science degree.
❌15 years of trading experience.
❌Intraday charts or real-time data feed.
What we’re doing is we’re developing trading systems that take signals from the daily bars or the weekly bars, and sometimes even the monthly bars. I trade and recommend most people start with daily bars, but it’s very simple. There’s a learning curve, and there’s a process to developing systems that work, but you don’t need that complex, expensive infrastructure.
That’s key because that means that you can get started quickly. What I want to do now is take you through an example, do some of the analytics, show you what some of the output looks like when you test a trading system, and try a couple of hypotheses so that you can get a bit familiar with the thought process and build some confidence that you can do this because you can. If you’re reading this article, have been trading for a little while, or learning about trading, you can learn to trade systematically, and I hope that this example will show you that.

Let’s say that we want to buy stocks that are in an uptrend, and we want to profit from the upswing. I’m just going to come up with a blunt hypothesis, an idea based on this goal, and we’re going to backtest it and see if it works. The first thing is the setup and the entry. We want to buy stocks that are going up, they’re in an uptrend, so I’m going to buy a stock when it crosses above the 200-day moving average, which seems sensible. You know that we talk about the 200 days moving average in the markets. A lot above the 200-day moving average is in a bull market. Below that, it’s in a bear market.
Let’s buy stocks that crossed above the 200-day moving average. I only want to trade liquid stocks that have a high volume turnover. I’m going only to trade stocks that average $500,000 of turnover per day on average. You can get that off the price chart. It’s just the combination of the closing price and the volume on each day. That’s going to be our setup for this example. We’re going to exit when the stock crosses back below the 200 days moving average. We want to profit from the upswing, so taking profit seems like a good idea. Let’s take profits if the stock moves 20% in our favor.
Then for initial stop loss, we won’t have a stop loss because this set of rules will exit if the price crosses back below the 200 days moving average. That loss will be contained to be relatively small anyway. Let’s start with our stop loss and see how that goes. Then for portfolio and risk management and position sizing, I want to diversify fairly broadly. Let’s put 5% of our capital, 5% of our equity into each trade, and we’ll use cash, no margin. When capital is limited, and we can’t take every signal we’re getting. We’ll just take the stock that has been trending the strongest, the stock that has moved up the most in the last 200 days.
You may or may not like these rules. I’m not recommending you trade these rules. It’s an example of demonstrating this approach. You can see how these rules define every aspect of how you’re going to get in and out of the market. Let’s switch over to Amibroker and run a backtest of these trading rules on the Australian stock market and see what happens.
The important thing here is, if you’re watching this and you have not used Amibroker, don’t get overwhelmed by some of the coding-type lines here. You don’t have to set all this up for yourself to get started and try it. The critical thing to understand right now is the concept of what are we trying to do.
Think about the rules that we just talked about and how they translate into the trading system. We’ve got the moving average, which is the 200-day moving average, and we said we’re going to buy when the price crosses above the 200 day moving average. We would only buy stocks that turn over half a million dollars a day or more. That’s what this line is doing. We said we would sell those stocks when the price crosses back below the 200 day moving average. The buy and sell rules pull it all together, this is the profit target.
We said we’re going to take profits with a 20% profit target, and this is the ranking mechanism. It says we’re going to give preference to the trades that have moved up the strongest in the last 200 days, and this is the position sizing. You need to learn the language a little bit, but please don’t be overwhelmed by that. What I want to do is show you how this works. Let’s run a backtest and see what happens. You can see I’ve selected this example for the online trading sum of the 200 day moving average crossover system. I want to test it from 1993 to 2019, and I want to try it on the Australian stock market.
I’m just going to test it on half of the market, on the stock starting with half of the stocks (Tickers starting with A – K). When you’re backtesting and optimizing and building a system, you’re going to have some in sample data where you just do the designing and testing, and then you want to have some out-of-sample data to validate your system on at the end. You don’t need to worry too much about that right now. I’m just going to backtest this on half of the market. Once it’s all set up, all you do is just hit the backtest button, and we’ll see what happens. What Amibroker is doing is going through all of the stocks in the Australian market over the last 25, 26 years and seeing every single time those trading rules were satisfied.
Every stock that it would have bought and every time it would have sold and assembled that into a portfolio. Let’s have a look and see whether that’s a good system. Here are the trading results, and I’m going to show you the chart. Look, this is a terrible system. This loses money consistently over 26 years. But what I want to show you is this, it loses money. You absolutely would not trade this system. But we’ve looked at 5,835 trades. That gives you far more information, far more confidence in your decision than it would if you sample 10, 20, 30, 50 trades.
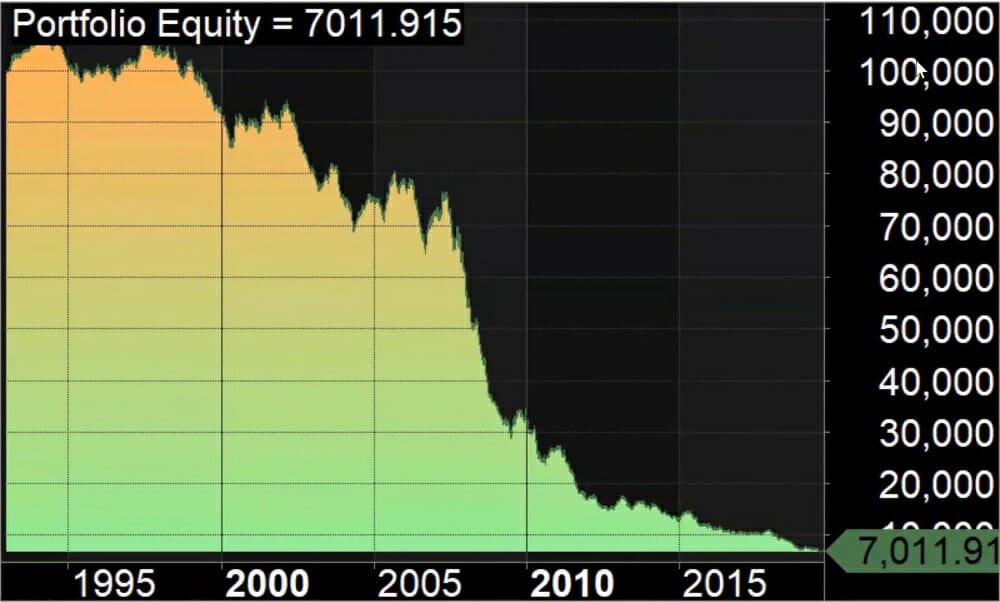
You’re getting a depth of analysis and understanding of how your rules perform over an extensive range of market conditions. In the last 26 years over this backtest, we’ve had bull markets, bear markets, rising interest rates, falling interest rates, political stability, political instability, wars, peace, we’ve had all sorts of things, and the backtest has gone through all of that. It’s told you. Frankly, these rules are not profitable. We’ve got a system that doesn’t make money. We had a hypothesis, and it’s a losing hypothesis.
We want to come back to the fundamental equation of trading, expectancy. Expectancy is the amount of money you expect to make per trade over the long run over many, many trades. It’s defined as the average winning trade, multiplied by the percentage of trades that win, minus the average losing trades times the percentage of trades that lose. If we look at the results we had, we have to take one or more of these levers and improve them to turn that into a profitable method. Let’s go back to the results now and talk you through where these levers are set at and make some decisions. We’ll improve this system, run another backtest and see what happens.

This is the backtest results, and this is all of the statistics, and there’s a lot here. I’m going to zero in on just a couple of things just to demonstrate the analysis. We don’t need to be overwhelmed or worried. The first thing is the winning trades down here, and we can see that only 17 and a half percent of the trades won. We wanted to trade stocks that were trending up. What is this telling us? This system currently is no good at picking stocks that are going up because very few of them are winners. We need to change that entry rule to better catch winners.
The next part of the expectancy equation was the average size of the win. This is 12%, not too bad. We might be able to improve that. Losing trades 82% losers. We know we’ve got to shift the balance there, and the average size of the losing trade is 3.68%. The losing trades are pretty small. We’re doing a couple of things right, but we’re just not getting enough accuracy in our system. My hypothesis here is that when the price crosses above the 200-day moving average, that’s just not a good enough signal. We want to be far more strict and define when a stock is going up. What I want to do is go to an extreme, just to demonstrate this.
Instead of buying when a stock crosses the 200-day moving average, let’s buy when a stock makes a new 500 day high. If today the stock is the highest it’s been in the last 500 days, it’s going up. I’m not recommending you trade this way. This is an illustration of the purposes of this exercise. What I’m going to do is come back to our system here, and I’ve got the rule down below. I prepared that one a little earlier, and I’m going to change the entry rule to enter when today’s closing price is the highest; it’s been the last 500 days and let’s see what happens. It’s how simple it becomes to test your hypotheses and to test your trading approach when you trade systematically.
Going back to Amibroker, and we’re going to run a backtest again and see what happens. Let’s look at the results. One change, and all of a sudden, we’re making money. It’s still not a good system. But you can see how we had a hypothesis about the entry. It was wrong and lost money. We found a new hypothesis, put it in, tested it, and now it’s making money. We tried this over 1,542 trades, and it took about half a second. I don’t know if you’re a discretionary trader. I don’t think in half a second you’d be able to test 1,542 trades. That is the power of the systematic trading approach.
You can get far more insight into your trading by having objective rules and backtest them, this is why I love it. Let’s look at those statistics of the expectancy equation and see what’s happening now. You can see how we’ve got 59% winning trades. Certainly better than the 17% we had before. We’ve got 19% average profit for the winners. Pretty good. We’ve got 40% losing trades. But now we’ve got a 22% average loss. When we lose on a trade, the loss is 22%. The problem here now is that the winners are 19%, and the losers are 22%. We want to increase the size of the winners relative to the losers so that we can make more money.
If you think back to the beginning, we hypothesized that we want to take profits at 20%. What would happen if we didn’t take profits then and let those winning trades go on and on and get bigger and bigger? If we take the profit target out, we will have a much better time of it. What I’m going to do is go back to the system here, and I’m just going to remove that profit target. Let’s just take that out entirely and see what happens. This is just to illustrate the power of backtesting and trading systematically because you can test these hypotheses so much easier than when you’re trading with discretion subjectively.
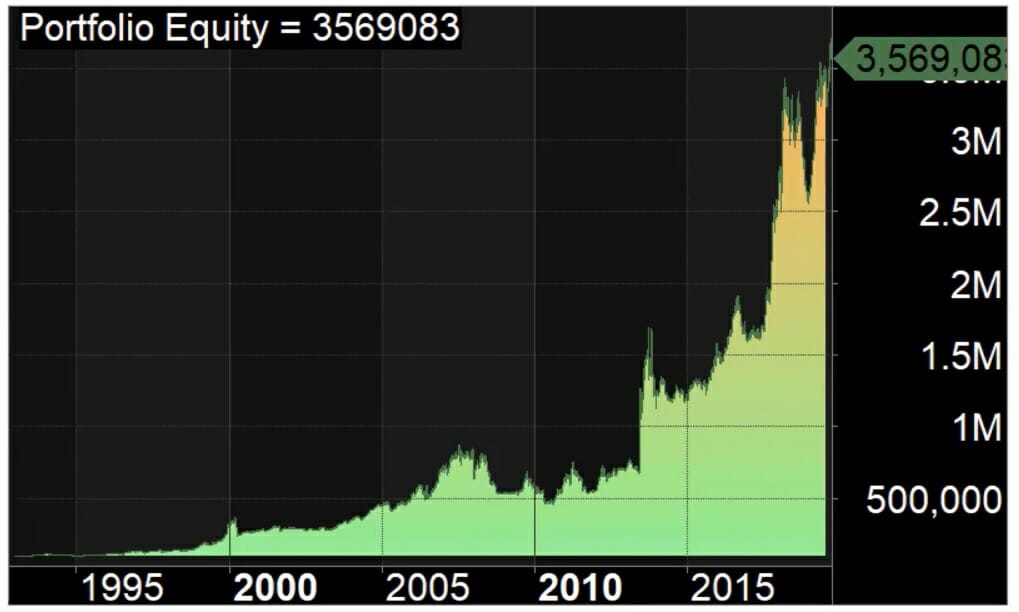
Let’s rerun it and see what happens. It took about a second, and we now have 521 trades. Let’s look at the chart. We’ve got a massive change here. Is it a good system? It’s heading that way. It’s still a bit of a fair bit of bumpiness in the equity curve, but you can see from 1995 to now. The system has made a lot of money. If we look at the statistics, we’ve got 48% winning trades. The average win is now 73%. By taking the profit target out, we’ve dramatically increased the size of the winners because we’ve allowed the trades to keep growing and growing and growing.
It’s one of the fundamental lessons that most traders miss is to make a lot of money. You need to have big wins, significant relative to your losses. Having profit targets where you snatch a quick profit is often counterproductive. We take the profit target out, and we have more of a trend following approach. All of a sudden, we’re making a lot more money. The average winner is 73%. The average loser is now 15%. You can see we’re getting much bigger winners, and relative to the size of the losses. This is on the way. It’s a lot better than it was at the beginning. Indeed, we’re making money.
We could probably try and shrink the size of the loss a little more. Let’s put a stop loss in. This stop loss is reasonably comprehensive. The detail is not that important. But the stop loss is going to be six times the average true range below the entry price. When you get in, it’s got a fair bit of room to move. But if it keeps going down, we’re going to get out. We’re not going to wait until it hits the 200-day moving average to get out. But if the trade goes in our favor, we will hold on until the price exceeds below the 200-day moving average.
It takes very little time to test the hypothesis. We’ve got 534 trades in the sample, and we’ve made even more money in the backtest. Adding the stop loss has improved the system even more. We’ve got 72% average profit per win, we’ve got 14% average loss, the equity curve looks a little better, and we’ve got a higher total profit at the end of the day. You can see that by taking this approach, you can very quickly refine and improve your ideas, test your hypotheses, eliminate the wrong ideas.
You might have one more idea that we’re just investing a flat 5% of our equity in every trade in this system. Wouldn’t it be better to adjust our position size depending on the risk of each trade so we can normalize our risk and take a standard percentage of risk on each trade? That’s another hypothesis we might test. Instead of using 5% of equity for our position size, let’s change it and make it half a percent risk per trade. If you have $100,000 in your account, then you’d be risking $500 on each trade.
I’ll get rid of this position size, and I’m just going to put in the code for a position size of half a percent of equity. We can run the backtest again, and we’ll see what happens. You can see the equity curve is now a little more smooth. It’s made about the same amount of money. We’re making 70% on average per win, and 17% pull per loss on average. The statistics are still good. This change is a little marginal. This is an example of a hypothesis that maybe it improves slightly, but it’s not that much.
This system now, as it stands, in the backtest made just under 15% per year for 26 years. A lot of traders out there are going to be going, “15% per year, that’s not enough. I need to make 50% per year.” But the reality is most traders are losing money, and 15% is a hell of a lot better than losing money consistently. One of the things I want to encourage you to do is if you’re not yet profitable, let’s get profitable, and then let’s continuously improve. It’s not about going from losing money hand over fist to making 50% per year. You’ve got to take some steps.
Don’t throw away an idea because it’s not making as much as you dreamt you could make. If it’s giving you an uplift in performance, shifting you from losing money to making money, that’s an incredible thing because very few traders make money. Systematic trading will allow you to do that much easier. I’m going to come back to the presentation now. We’ve been through expectancy, and we’ve improved a system. Is it a good system? No, there are far better systems. I’m going to show you a better system right now, one that I trade myself, and I’ll run the backtest event and show you what that looks like.
Let’s have a look at a good system. One of the private systems that I trade is called the Freight Train.
What Is The Freight Train?
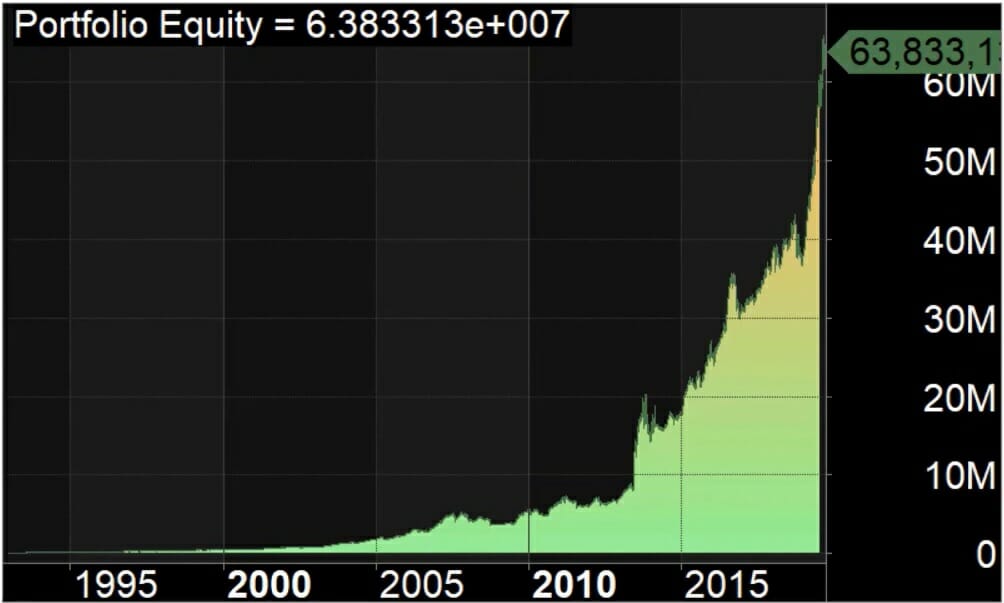
The Freight Train is a trend-following system on Australian stocks, and it gets in on strength, and it holds those stocks until they’re trending until they’re no longer trending up. It’s a reasonably long-term system. But look at what you can achieve with a good system. I’m running it. Backtest the Freight Train now. This is what the equity curve looks like on a good trading system. This system made 27% per year on average over the last 26 years.
It got 45% of its trade right, the average winner was almost 83%, the average loss was only 13%, nearly 14%, and the maximum drawdown that this system incurred was 31%. Most traders who are losing money would be ecstatic with this sort of result, making 27% per year with a drawdown of only 31. When you think I’m trading Australian stocks this is astronomically better than a buy and hold approach if you compare that to the Australian stock market index. It’s astronomically better than losing money consistently when you’re trading erratically, you don’t have a profitable method yet.
What Are The Advantages of Systematic Trading?
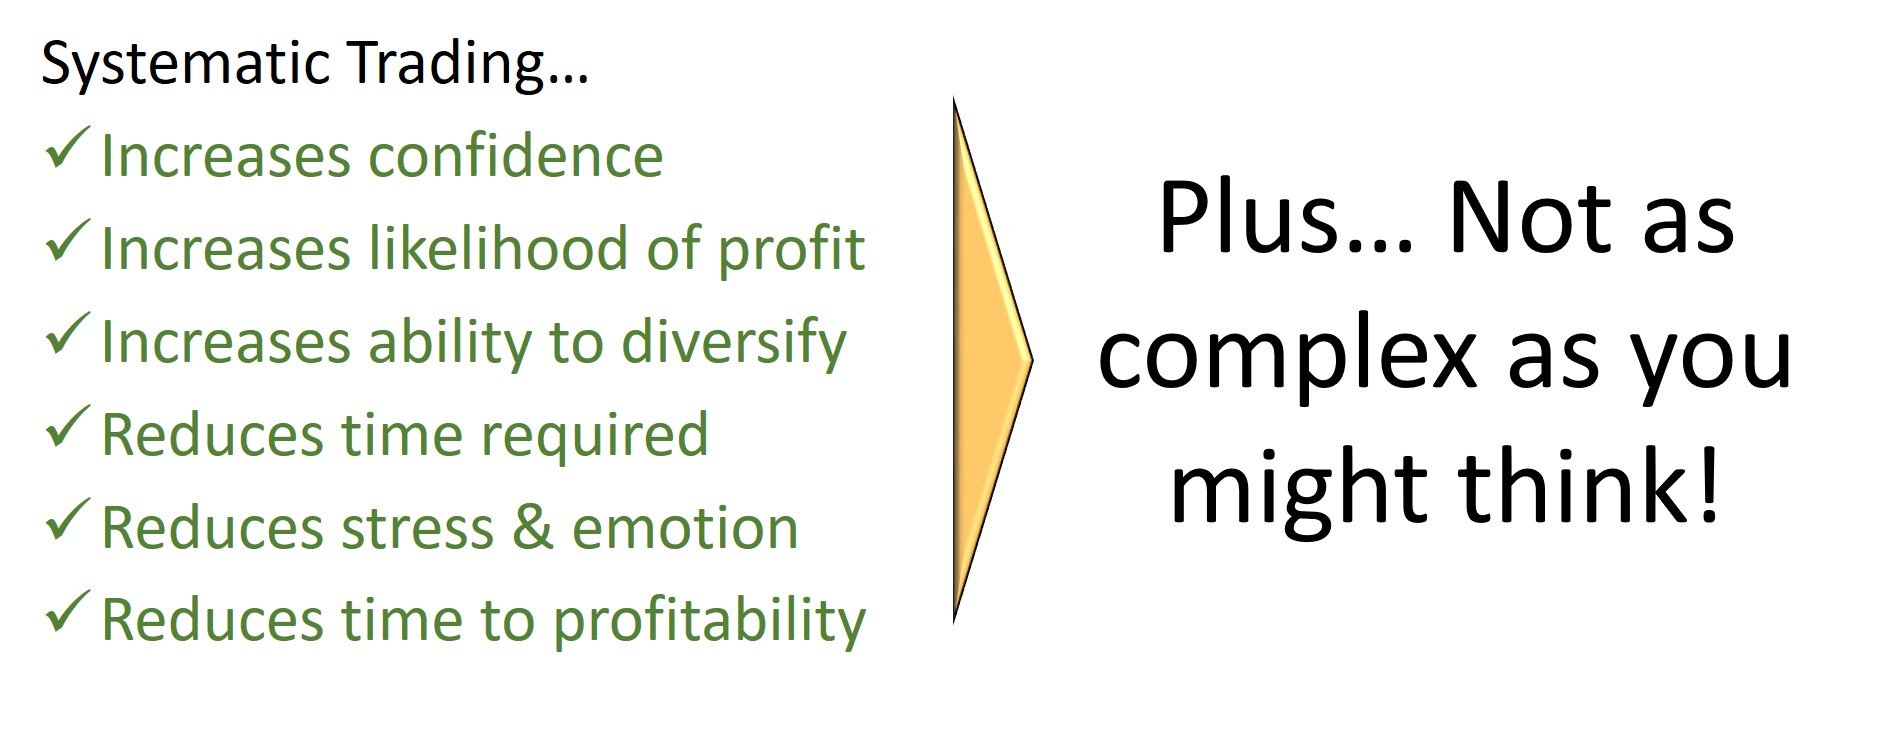
- Increases your confidence. You’re able to get a lot bigger sample size quickly. You can look at many more trades over a much longer period over more market conditions to determine whether your method is profitable.
- Increases your likelihood of profit. You can evaluate your system performance or the performance of your rule over many different market conditions, and you’re not going to start trading a system that is losing money in the backtest. Whereas if you are using a subjective method that you can’t backtest, then there’s a good chance that you don’t have enough data, and that approach may not be making you money.
- Increases your ability to diversify. Like I mentioned before, I’m very comfortable holding 40 to 60 positions in my portfolio. The great thing about that is that I can dramatically reduce my stock-specific risk because my positions are so small, but it doesn’t affect my results. I can move my returns. I’m far less sensitive to fluctuations in any one position in my portfolio because a system allows me to diversify more and still take only 10 to 30 minutes a day to do my trading.
- It reduces the time required to trade.
- It reduces stress and emotion. All I have to do every day is follow my rules, look for the buys, look for the sells and execute.
- It reduces the time to profitability. You don’t have to pay per trade for as long as you don’t have to test out different methods. You can start trading when you have a set of profitable rules, and not before. You can become profitable as a trader far more quickly. Plus, it’s not as complicated as you might think.
As you’ve seen, a straightforward set of rules gives you an edge, and this is fantastic because so many traders out there are prone to overcomplicating. When I first started trading with charts and indicators, I had 10 to 15 different indicators on my charts which was ridiculous. There were squiggly lines all over the place, plus trend lines and support and resistance and all that. But with a very simple set of rules, you can make a ton of money, and you can test it and get confidence in that. That’s why I love systematic trading.
Systematic Trading Workflow and What it Looks Like on a Daily Basis
Until you bring this to life, it’s hard to imagine yourself as a successful systematic trader. What I’m going to do is show you step by step exactly how I run a trading system, using the example that we’ve just worked on.
1. Update share price data.
The first thing we have to do, and we do that outside of Amibroker, is we have to update our share price data. It comes down to opening up your data provider’s application, pressing the update button, and wait a couple of minutes. It’s a very simple process. All it does is it goes to the server, pulls down the share prices from yesterday, and adds them to your database. We will assume that that step is done, and it just takes a couple of minutes. What do I do in the morning when I’m updating my data? I turn on my computer, open up the data application, press the update button, and make a cup of coffee. Then I come back, and my computer’s ready to go.
2. Check your open trades.
The next step is to check your open trades. You want to check your open trades to see if you’ve had any exit rules. There’s a couple of ways you can do it, but we’re just going to do it visually on the chart. I’ve got this watchlist here, and the watchlist has all of the stocks currently in this portfolio. You might remember the exit rule is when the price crosses below the 200 day moving average. This is the share price chart, which is a daily chart. Here’s the current day’s price, and here’s the 200-day moving average. We’re only going to exit a stock if today’s close is below the 200 day moving average. That’s the exit rule in this system and each system have its own exit rule. You just put those exit rules in the chart, and you can scan for them, either visually or you can write a scanner to do it quickly.
But let me demonstrate why this is so quick because we can look at the chart say that there’s no exit. This one’s no exit. We’re scanning through all of the open positions in the portfolio, and none of these has a price crossing below the 200-day moving average. These are all the open positions in this portfolio right now. You can see it’s rapid and easy to evaluate whether or not you’ve got an exit rule. Today, for this system, there are no-sells to be made. There are no stocks I have to close. That part of the workflow is done.
If you did get an exit rule, all you need to do is open up your broking platform and sell that stock. That’s all when that job is done. Once you’ve checked the exit rules, you can place your orders if you need to.
3. Look at the total equity.
We need to know if we have enough cash to take another trade. Let’s say you’ve got $100,000 in your account, and you’ve got $95,000 worth of stocks in your account. We’re not using leverage for this example. You’ve got $5,000 of spare cash. You’ve got $5,000 you can place a trade with. What we’re going to do now is we’re going to scan the market and see if there are any buy signals today.
We do that in Amibroker. The great thing is the system is coded to do a backtest, and it’s also coded to run a scan. So what I’m going to do now is demonstrate how to scan for your trade. We’ve already looked at our open trades, we’ve determined whether or not we had any sell signals. If we had sell signals, we’d place them with the broker. What we’re doing is looking for open trades—looking for new trades to open, instead. For example, you have $100,000 in your account, and you’ve got $95,000 worth of open positions, so you’ve got $5,000 of spare capital that you can use to deploy into new trades.
4. Scan the market to find all the stocks that meet the buy criteria.
What I’m going to do now is scan the market to find all the stocks that meet our buy criteria today, and then those are the stocks that we’re going to buy. You can see here we’ve got the Online Trading Summit example system that we were playing with before, and we’re going to scan the entire Australian stock market over the last day, one recent bar. We’re going to see if there are any buy signals. Let’s explore the market and see what happens. You can see there’s only one stock that’s come up for us to buy, and it’s taken about a second. Amibroker tells us it’s 1.54 seconds to scan over 2,000 stocks in the Australian market to find the one that meets our buy criteria.
We’re going to buy EVS today. The closing price of EBS was 34 cents, and the stop loss that we’re going to place according to our rules is 16 cents wide. We’re going to buy 3,000 shares, and the value of that position is $1,044. What do you do now? You open your broker platform, you get up an order ticket, and you place this trade. Once you’ve done that, this step in the process is complete. Some days you get no signals; some days you might get 20 signals, and what you do is you know how much spare capital you’ve got. You automatically rank the trade when you run a scan like this, so you’ve got the highest preference first.
If there were three or four trades in here, you basically take the first trade first and then the second trade and then the third trade until you run out of capital. Then your buy orders are done for the day. Once you’ve done that, the next step is to take this trade, and we’re going to place it into a watchlist of open trades. Let’s add this stop to our Online Trading Summit example watch list. Tomorrow when it comes time to check our trades, and we’re going to review our exits tomorrow, that new trade will be on the watchlist. If you sold any stock today, you would remove them from the watchlist just by basically going to the watchlist and removing that symbol.
You can see how the workflow for this is straightforward, and it takes very little time. I’ve explained it all, and it’s still taking only 10 minutes or so. The key message here is you get far greater confidence, a greater chance of profit. You can diversify way, way less time to trade this way. It reduces stress. The biggest stress in that process was getting the words out of my mouth while I was doing the process. There’s no emotional attachment or impact to taking those trades, buying or selling.
It reduces your time to profitability because you can start trading with the proper approach. You don’t have to fumble around for years trying to find a profitable strategy. As soon as you get a profitable system and start trading if you follow that system well, you generate the expectancy of that system. That’s a demonstration of systematic trading on both the backtesting side and the daily workflow side. Backtesting gives you confidence, ensures you’ve got a profitable method, and the daily workflow ensures consistency and repeatability, and it reduces the amount of time it takes you to trade.
if you would like to learn how to quickly implement all of these learnings into your own trading, then click the button below to find out more about the trader success system and discover how you can implement your own portfolio of trading systems in the next two months.








Thanks
Adrian for a great introduction to your way of trading very thought provoking
and eye opening how to systematically trade and what is needed to succeed
as a systematic trader the passion for your system and the way you approach
every task comes across in your explanations.