When learning any subject, understanding the language is the first step to mastery and it is no different when you learn stock trading. Learning how to trade in stocks, you must understand the most commonly used stock market terms.
Understanding these stock trading terms will accelerate your learning and improve your understanding so you can master more complex concepts more quickly.
Click on the trading terms in the table of contents you want understand OR just read this entire page top to bottom. Be sure to leave me a comment to let me know what other stock market terms you want to learn more about so I can expand this FREE Trading Language guide for you!
ABC Pattern
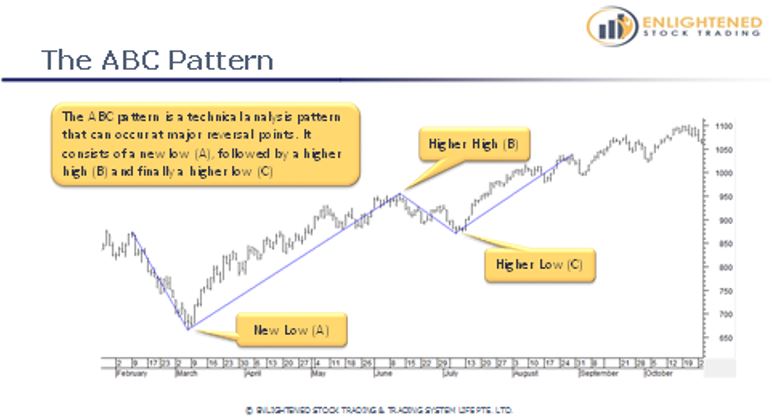
The ABC pattern is a technical analysis pattern that can occur at major reversal points. It consists of a new low (A), followed by a higher high (B) and finally a higher low (C)
Average
The average of a data set is equal to the sum of all components of the data set divided by the number of elements in the data set.
Beta
This is the amount the stock moves compared to the amount the market moves.
For Example:
- If a stock moves by 2% every time the market moves by 1% then it has a Beta of 2.
- If a stock moves by 0.5% when the market moves by 1% then it has a Beta of 0.5
Black Swan
These are rare but large events that move the market prices by a significant amount. It could be a positive move, but most commonly used in the context of a negative market shock.
The term was popularised by Nassim Taleb in his outstanding books “Fooled by Randomness” and “The Black Swan”.
Bonds
Bonds are debt investments in which investors loan money to the issuing entity for a predefined timeframe in exchange for regular interest payments. Interest payments may be fixed or variable but are usually pre-specified according to a certain formula.
Entities that issue bonds can include federal / state / municipal governments, Corporations. The holders of the bonds are effectively the holders of the debt of the issuing entity.
Breakout
A breakout is a price movement that passes through a key support or resistance level.
Bull Market / Bear Market / Correction / Pullback / Crash
Watch the video below for an explanation of the following terms:
- Bull Market: A market that is trending upwards over the long term
- Bear Market: A decline of >20% from the recent high in the market
- Pullback: A small move against the main trend usually of less than 10%
- Correction: A correction is a move against the main trend of more than 10%
- Crash: A sudden and dramatic drop in share prices in the order of 20-30% or more
Buy and Hold
Buy and hold is a passive investing strategy in which the investor identifies shares to include in their portfolio and purchases them with the intention of never selling them (or at least not selling them in the foreseeable future) regardless of how the share price moves over time.
CAGR
CAGR is short for Compound Annual Growth Rate. This is the hypothetical rate at which your investment would have grown if it grew at a steady rate throughout the entire period being measured. CAGR is usually quoted as an annual % growth rate.

Call Option
A contract which gives the contract holder the right, but not the obligation, to buy the underlying security at a certain price (strike price) on or before a certain date (expiration date)
Capital Gains & Dividends
Watch the video below for an explanation of capital gains and dividends
CFDs (Contracts for Difference)
Contract For Difference is a derivative product which mimics the price movement of the underlying asset (such as a share price) but has leverage built into it.
Generally used for short term trading and traded on margin. For example a CFD for ABC stock may have a 15% margin, which means that to control $10,000 worth of that stock you must place a $1500 margin with your broker.
Chart Period
The chart period is the amount of time that each bar represents on a bar chart. The most common chart period is the daily chart where each bar represents a single day of trading. Other chart periods you may come across include:
- M1 – 1 minute bars
- M5 – 5 minute bars
- H1 – 1 Hour Bars
- H4 – 4 Hour Bars
- D – Daily Bars
- W – Weekly Bars
- M – Monthly Bars
Closed Trade Equity
Closed trade equity is the equity you have in your account if you do exclude open trade profits. (See also closed trade profit below)

Correction
A correction is a move against the main trend of more than 10%. There is no single person that ‘corrects’ the price, it is just that the participants in the market cause the price to trade lower.
Correlation
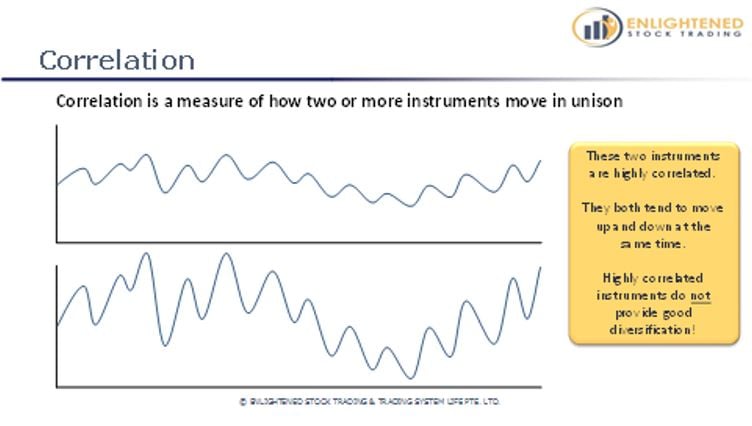
Correlation is a measure of how two or more instruments move together. Instruments that tend to move in the same direction at the same time are positively correlated. Instruments that tend to move in opposite directions are said to be negatively correlated. Instruments who’s movement have no relationship are said to have zero correlation.
Crash
A crash is a large, sudden and unexpected drop in asset values typically caused by broad market panic precipitated by an unexpected event. Typically a stock market crash (Such as occurred in October 1987) results in a drop of 30% or more over just a few days.
Note that the financial media use the term ‘crash’ far more than is actually warranted. Note the difference between a pullback / correction / crash (A pullback is a move of less than 10%, correction is more than 10%). For further explanation please watch the video in the Bull Market / Bear Market section above.
Data Range
Data range is the spread between the highest and lowest value in the data set.
Day Trading
Day trading is a broad term that includes any trading strategy that enters and exits the market on the same day. Day trading strategies typically do not carry any positions overnight when the market is closed.
Derivative
Derivative is a general term for financial instruments that are contracts between two parties in which the price of the contract is derived from the prices of an underlying financial instrument (usually a stock, bond, commodity, currency or index).
Examples of common derivatives include:
- CFD’s
- Warrants
- Options
- Futures
Derivatives are usually traded on margin allowing for a high degree of leverage in trading. Derivatives can be used for hedging or trading and can be traded on an exchange or over the counter (OTC).
Dividend Yield
Dividend yield is the sum total of the dividends paid per year as a percentage of the stock price.

For Example:
If ABC stock pays a dividend of $0.06 per share each year and the share price is $2.5 then the dividend yield is:

Drawdown
A drawdown is simply a decline in your total equity from a previous peak. It is caused by trades moving against you and trading losses.

Drawdown is usually measured as a percentage decline from the previous high. The formula is:

For example, if your highest equity in the past was $100000 and your equity now is $80000 then your drawdown currently is 20%

Equity
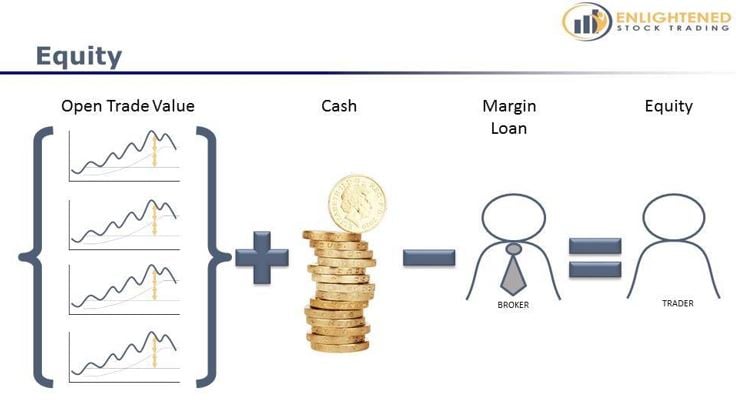
Your Equity is the total value of your cash + positions – loans in your trading account
Exchange Traded Fund
A type of managed fund that has units listed on the stock exchange which trade like regular shares.
Exit Trigger
The exit trigger is the exact rule(s) under which you will exit / close a trade. Exit triggers may be any of the following:
- Trailing stop
- Time stop
- Profit stop
- Indicator exit
- Price Pattern
Expectancy
Expectancy is the amount of profit you expect to make per dollar you risk in the market over many trades. Expectancy is the average R-Multiple over many trades. This number must be positive. More positive means your system has a bigger edge. For example, a system with expectancy of 0.5 is profitable, but a system with an expectancy of -0.08 is not profitable.
Exposure
When used in reference to your overall portfolio it is the exposure of all pThis is the total value of your position. For example, if the stock price is $5.00 and you have 200 shares, then your exposure on that stock is $1000.
When used in reference to your overall portfolio it is the exposure of all positions added together. Long exposure and short exposure are often calculated separately because this is useful for managing your risk – equal long and short exposure would give you a lower risk than long only exposure (though returns may not necessarily be better with equal long / short exposure).
Fat Tails
In statistics (and trading), the term ‘fat tails’ refers to a distribution having a greater population of results at the extremes than would be predicted by a ‘normal distribution’.
In trading in particular the term ‘fat tails’ is used to describe extreme moves in the markets which happen with much greater frequency than would be predicted by a normal distribution.
Futures
Contracts to buy or sell certain commodities or financial instruments at a pre-specified price at a certain time in the future.
Futures contract place a binding obligation on both buyer and seller of the contract to take physical delivery of the commodity in question if the contract is still held on the settlement date. Futures contracts are traded on margin and generally allow for high leverage.
Gap
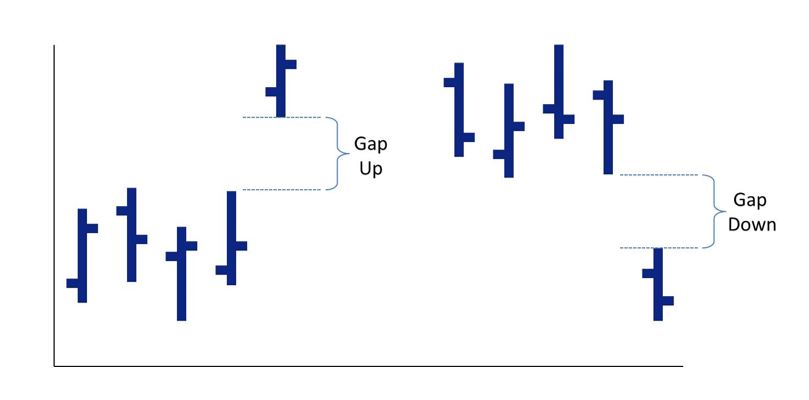
A price move in which the entire bar is outside the range of the previous bar. The space between the price bars is called the ‘gap’.
High Frequency Trading
Ultra fast trading performed by proprietary trading firms and banks utilizing huge investments in computing infrastructure and high speed connections to the exchange. HFT is not a strategy that individuals can compete with directly.
Index Fund
An index fund is a low cost passive investment vehicle which seeks to mimic the performance of a specific stock index by holding the shares that make up the index in the same weightings as the index.
Initial Stop Loss
The level at which you would admit you are wrong and close a trade if it moves against you. Usually calculated in one of three ways:
- Logical chart based stop using support or resistance levels
- Volatility based stop using a certain multiple of ATR or Standard Deviation from the entry price
- Percentage based stop set to be a certain percentage away from the entry price.
- Indicator based stop set using an indicator such as a moving average, Parabolic SAR or other indicator to calculate the stop value.
Limit Order
Limit orders are an order type that specifies the price you are willing to pay up to (if you are buying) or sell down to (if you are selling).
Limit orders are used when you want to be sure you know exactly what the worst price you will pay is assuming your trade gets executed.
For example, let’s assume you are buying ABC stock. The current bid is $10.25 and the ask is $10.30. You know that the stock can be illiquid and you realize that the current spread is a little wider than normal, so you don’t want to incur too much slippage.
Instead of placing a market order (which would be filled at $10.30), you decide to place a buy limit order at $10.24. This order sits in the market and will only be executed if the offer (the lowest price the sellers are willing to sell at) drops to $10.24. When this happens you should be executed at this price. In this case you have specified that $10.24 is the highest price you are willing to pay to buy the stock.
If the market never comes back to the price of your limit order, your order will not be executed
Similarly when using a limit order to sell, you set the minimum price at which you are willing to sell the stock, and if the bid price reaches that level then your order should be executed (provided the bid price stays at that level long enough and there is sufficient volume buying interest at that price).
Limit orders generate no slippage because you have specified that you are only willing to trade at a certain price…however, your trade may not be executed if the price never hits the level you specify.
Liquidity / Market Depth / Buy-Sell Spread
Liquidity is how much volume of buying and selling occurs. In a more liquid stock a greater value of that stock changes hands every day, so it is easy to buy and sell without changing the market price.
With less liquid stocks it is harder to buy and sell without moving the price because there are not many buyers and sellers ready to take your order.
Market Depth and Buy / Sell spread are explained in the video above.
Long Side / Short Side
Watch the video below for an explanation of what is meant by ‘the long side’ and ‘the short side‘.
MAR
The MAR ratio is a measure of trading system performance which divides the annual return generated by the system by the largest drawdown. This is a very useful measure of how good a system’s performance is because it allows you to quickly eliminate systems with large drawdowns relative to the returns generated. I personally use the maximum percentage drawdown when calculating MAR.
A MAR ratio of 1 or more is good – it means that the maximum drawdown is less than the average annual rate of return (CAGR)
The higher the MAR the better the strategy or trading system is performing.
Margin Loan / Leverage
Watch this video for an explanation of margin, margin loans and leverage:
Example:
- I have $100,000 to invest and I get a margin loan from my broker which allows me to borrow another $100,000…this means I now have $200,000 to invest in the market with a loan of $100,000 to my broker.
- I buy shares with the $200,000. If the value of the shares goes up to $300,000 then I now have $200,000 equity and my loan is still $100,000. So if I sell the shares and pay off my loan then I walk away with $200,000 (before tax)
- If instead the value of the shares drops to $150,000, I now have $50,000 equity and a $100,000 loan. So if I sell my shares and pay off my loan then I walk away with $50,000
Market Order
A market order is simply an order that will be filled at the prevailing price in the market at the time the trade is placed. Market orders are generally always filled, however, you may not get the price that you really want because the order is filled at whatever the market is currently offering.
Let’s assume you are buying ABC stock. The current bid is $10.25 and the ask is $10.30. This means at this moment buyers are offering $10.25 per share and sellers are asking for $10.30 per share. If you place a market order to buy then you will be filled at $10.30 (assuming there is enough volume on offer at that price). If you place a market order to sell then you will be filled at $10.25 (again assuming there is enough volume on offer at that level).
If you have a highly liquid market and you are trading relatively small quantities then market orders can generally give you a reasonable price under normal circumstances, however, there are many cases where a market order will not give you a good price such as:
- Your trade size is large
- The market is moving quickly
- The instrument you are trading is liquid without much volume on offer
- There is a delay in placing your order into the market
A market order will execute at the prevailing market price when the order hits the market. This means that if any of the above situations occurs the market order could be filled at a price quite different from what you expect.
Most markets and trading platforms will accept market orders. You will find that market orders generate the highest slippage…but they are executed more frequently than limit or stop orders.
MAR Ratio
The MAR ratio is a measure of trading system performance which divides the annual return generated by the system by the largest drawdown. This is a very useful measure of how good a system’s performance is because it allows you to quickly eliminate systems with large drawdowns relative to the returns generated. I personally use the maximum percentage drawdown when calculating MAR.
Maximum adverse excursion (MAE)
MAE is a measure of how far a trade moves against you over the course of the trade. It is useful to know how far individual trades drawdown before moving into profit to help refine where initial stops are set and improve the reliability (% wins) of the trading system.

Mean Reversion
A trading strategy that seeks to profit from prices moving back towards some mean or average level after moving to an extreme. Eg, buying a dip in anticipation of price rising back up to the medium term moving average. This is typically short term in nature, but time-frames for mean reversion strategies vary widely
Median
The median value of a data set is the middle value. If all data points are ordered from lowest to highest, the median is the value which has an equal number of data points above and below it.
IThe median and average (mean) are similar for normally distributed data, but can vary dramatically for heavily skewed distributions.
Mutual Fund
A professionally managed investment vehicle that pools money from a large number of investors to purchase securities or other investments.
Normal Distribution
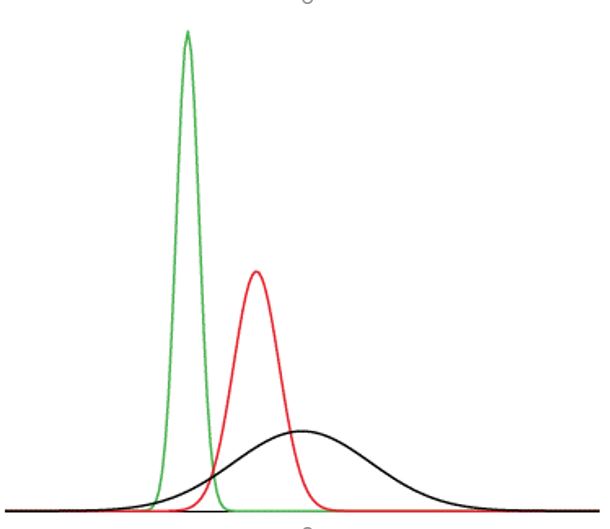
Most people know the normal distribution as the ‘bell curve’ that was used to grade marks in school. A normal distribution is centred around its mean, symmetrical on both sides of the mean.
Normal distributions have a relatively higher concentration of results around the mean and relatively few results in the ‘tails’ which are the extremes away from the mean.
In a normal distribution, 68% of the results are within one standard deviation of the mean and approximately 95% of the results are within two standard deviations of the mean.
Open Trade Equity
Total profits from all positions that are not locked in with stop loss order.
For Example, if your trade in ABC stock has a share price of $10.50 and you will exit the trade at your stop loss of $9.50, then you have an open profit of $1.00 per share in that position.
To get the open trade equity you must add this together across all positions.
(See open trade profit below)

Open Trade Profit
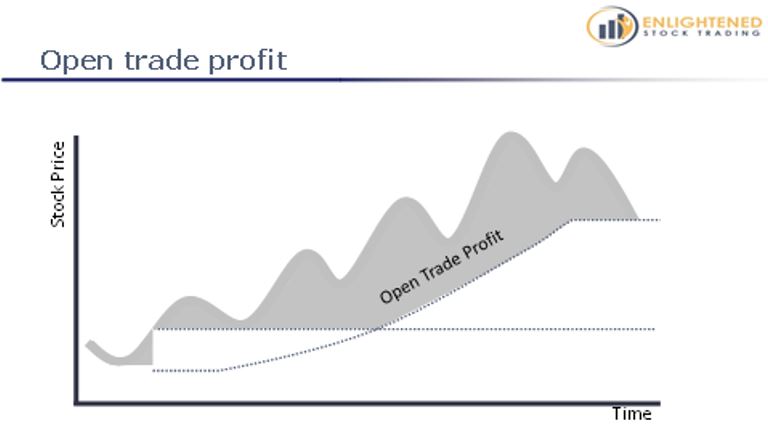
This is the difference between the current share price and the price at which you would sell if it started to move against you. For example, the stock price is $4.50 and your trailing stop is at $3.95, then your open trade risk is $0.55 per share.
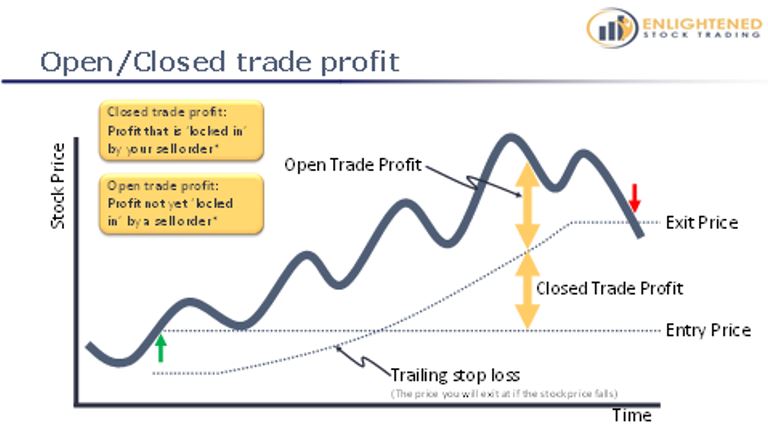
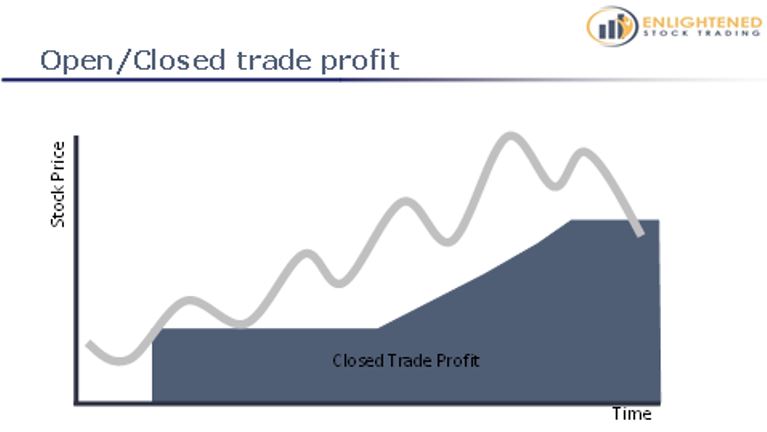
The closed trade profit is the proportion of the trade profit that is ‘locked in’ by your exit price / trailing stop:
The open trade profit is the proportion of the trade profit that is not yet ‘locked in’ by your exit price / trailing stop:
Optimization
A method of varying input parameters to find the best output value from a function. For example, we may vary the parameters in a trading system to find the parameter set most likely to generate a profit from future trading.
Portfolio Heat
Portfolio heat is the total amount of risk your portfolio is exposed to across all positions – both long and short. This is calculated as the distance between the current price of your position and your exit price multiplied by number of shares or contracts summed across all of your open positions.
For example, if the current stock price is $100, your stop loss is at $90 and you are holding 500 shares, this trade will add ($100-$90) x 500 = $5000 to your portfolio heat.
In practice traders usually don’t have to measure this manually as most trading software used for backtesting will have a portfolio heat measure which can be adjusted to stop you from taking on too much risk.
Position Size
Your position size is the number of shares or contracts you hold in a particular trade. Managing your position size is one of the most important risk management techniques. Good risk management practice dictates that the risk per trade is kept low (less than 1%).
Price Pattern
A price pattern is a general term for patterns that can appear in stock price charts. Commonly used by technical analysts, patterns can include triangles, wedges, double tops, double bottoms, head and shoulders patterns and many others.
Price patterns can be powerful, however, they are quite subjective unless described precisely and coded into software which identifies the pattern objectively. While they do not typically feature heavily in trading system rules, price patterns can be a useful way to generate price signals if they can be coded.
Several price patterns are explained in this document below. In addition, a useful explanation of several common price patterns can be found on Investopedia here: http://www.investopedia.com/articles/technical/112601.asp
Pullback
A small move against the main trend usually of less than 10% (see video above)
Put Option
A contract which gives the contract holder the right, but not the obligation, to sell the underlying security at a certain price (strike price) on or before a certain date (expiration date)
Pyramiding
This is when you add to your position as it moves in your favour. This is done to capitalise on the trend that you have identified.
R Multiple
This is the Return on a trade divided by the risk for that trade:

For example:
- If you enter a trade at $5.00, and you place your initial stop loss at $4.50 and later exit the trade at $10, then the R-Multiple for that trade is 10
- If you enter a trade at $5.00, and you place your initial stop loss at $4.50 and later exit the trade at $4.75, then the R-Multiple for that trade is -0.5

Range Contraction
Range contraction is a short term reduction of the daily range. This is often followed by a range expansion in the direction of the prevailing trend and can be a good, low risk point to enter a trade in anticipation of a breakout / range expansion. (Note: Test all ideas and assertions like this for yourself before using)
Range Expansion
Range expansion occurs when the distance from the low to the high of the day is wider than previous days. This can be used as a confirmation of trend continuation. Wide range bars are can be an important confirmation tool when trading breakouts from a trend line or a support or resistance level.
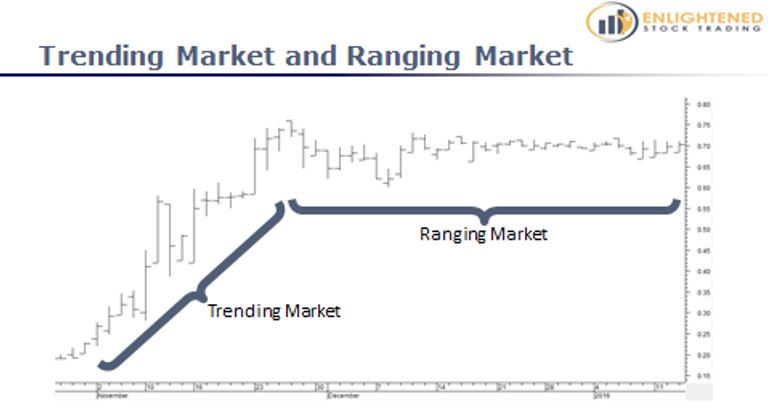
Ranging Market
A ranging market is a market where the prices are moving sideways with no clear trend. Prices may move up and down gradually but are not clearly trending either up or down over time.
Risk Management
These are collectively all the actions you take to protect and preserve your capital. Risk management levers include (but are not limited to):
- Risk per trade
- Maximum exposure per instrument
- Maximum number of open trades
- Maximum number of new trades per day
- Portfolio Heat
- Total Exposure
- Long / Short Exposure
Risk of Ruin
This is the probability that you will hit your ‘ruin’ point where you will have to stop trading. This is usually $0 equity or close to zero equity. Determine the risk of hitting that ruin point with historical simulations.
Scale In
This means to gradually buy shares, usually in regular sized blocks until you have built up your full position in a stock. This can be done at regular time or profit intervals, or by building your position when certain price patterns / indicator signals occur.
Scale Out
This means to gradually sell shares, usually in regular sized blocks until you have closed your full position in a stock. This can be done at regular time or profit intervals, or by building your position when certain price patterns / indicator signals occur.
Setup
These are the conditions under which you would consider entering a trade. For example in long side trend following, you may have a setup that requires a strong trend to be in place, low volatility and a slight pullback in prices.
Sharpe Ratio
The sharpe ratio is a way of measuring performance of an investment relative to the risk free benchmark taking into account the risk (or variability) of the returns.
The sharpe ratio measures how well the investment compensates the investor for the risk taken. As the excess returns increase, sharpe ratio increases. But if the standard deviation of returns increases then the sharpe ratio decreases because the investment is considered more risky (due to the variation in returns).
The formula for Sharpe Ratio is:

Where :

Note: This is not often used by traders to measure their own trading system performance because it has several flaws which are beyond the scope of this discussion, but it is commonly used in the investment industry so it is important to have an understanding of the concept.
Skew
Skew is a statistical measure of the symmetry of a distribution around the mean.
- A positive skew means that the tail on the right side of a distribution is longer and fatter than the tail on the left side.
- A negative skew distribution means that the tail on the left side is longer and fatter than the tail on the right side of the distribution.
- When looking at a distribution of trades generated by a trading system a positive skew is more stable for trading because there are unexpectedly large winning trades.
- In a negative skew trading system there are unexpectedly large losing trades (which is obviously more risky)

Standard Deviation
Standard deviation is a measure of how dispersed a data set is around it’s mean. The more spread apart the data, the higher the deviation. Standard deviation is calculated as the square root of variance.
Stock Symbol / Ticker / Bar Chart (Hide)
Watch the video below for an explanation of the stock symbol, the stock ticker and bar charts.
Stop Limit Order
A stop limit order can help you overcome one of the major drawbacks of a traditional stop order or stop loss order – Slippage.
With a traditional stop order or stop loss order, the trader specifies the price at which they want their order to become active. When the price hits that level the order is placed as an at-market order. The trade will then be executed at the prevailing price.
A Stop-Limit Order can help you reduce the effects of slippage compared to a stop order or a stop loss order, but this comes at the cost of certainty of execution.
A stop-limit order specifies a stop price which, when hit, converts your order to a limit order. This order will then only be executed at the specified price or better. The two examples below illustrate a buy and sell situation respectively:
Example 1: Buy Stop-Limit Order
Say you wanted to buy ABC stock (currently trading at $25) if it rises to $30, but you want to ensure you don’t pay more than $30. If you place a buy stop limit order to purchase ABC stock at $30 or better. This order will only become active if the price moves up to $30. Once active it will only be executed at $30 or better.
Example 2: Sell Stop-Limit Order
Say you wanted to sell ABC stock (currently trading at $25) if it falls to $20 to limit your loss, but you want to ensure you don’t suffer too much slippage. If you place a sell stop limit order to sell ABC stock at $20 or better. This order will only become active if the price moves down to $20. Once active it will only be executed at $20 or better.
Stop Order
Stop orders are orders that are placed above the current market price for buyers or below the current market price for sellers. These orders are only triggered if the price hits the level specified. Once the level specified is reached, the order is converted to a market order and placed into the market.
For example, let’s assume you are buying ABC stock. The current bid is $10.25 and the ask is $10.30. You are not sure if it is going to continue on its upward trend, so you place a buy stop order at $10.35. This order remains dormant until the market price rises to $10.35, at which time it is converted to a market order and placed into the market.
Now let’s say you want to sell ABC stock, which is again trading at $10.25/$10.30, but you only want to sell it if the stock continues to fall to $10.20. So you place a sell stop order at $10.20 which will be dormant until the market drops to $10.20 at which time it will be converted to a market order and placed into the market.
Once a stop order is triggered and placed into the market, it has all of the qualities of a normal market order discussed above. The only difference is that you have specified a price at which you want your order to be placed into the market.
Swing Trading
A trading strategy that profits by catching the price swings above and below the primary trend. Shorter term in nature with smaller but more frequent wins than trend trading. Swing trading strategies typically have holding periods from several days to several weeks.
Time Stop
A method of exiting which is related to how long since the trade was opened. For example, a 40 day time stop means that the trade will be closed after 40 days no matter what the share price.
Trade Database
Your trade database is the record of all trades that you have taken. It includes all relevant details about the trade including:
- Analysis Date
- Stock Code
- Exchange
- Account (if you have multiple accounts)
- The system that generated the trade
- Entry Date
- Entry Price
- Initial stop loss level
- Target price (if relevant)
- Currency
- Total equity
- Risk per trade (%)
- Risk per trade ($)
- Number of shares or contracts
- Exit Date
- Exit Price
- Explanation (if your approach is not 100% systematic)
As a trader you will need to keep a record of every trade you make for position sizing, risk management, performance improvement and tax purposes.
Trading Journal / Trading Diary
A document in which you record all of your market observations and investigations to ensure you have ongoing access to everything that you have looked at and tested in the market. Over time this becomes a very rich repository of information that will become an invaluable resource.
Trading Plan
A trading plan is a written document that describes everything you need to do to run your trading business. It is much broader than just the rules you use to enter and exit the market. It includes the following 8 components:

Trend
The trend is the general direction of price movements. There are generally three trends – the long term (>3 months); the medium term (1-3 months); and the short term (<1 week)
A trend is essentially a sustained price move in a single direction (either up or down) over a period of time.

Trend Line
A trend line is a sloping line drawn on a bar chart which joins the successive higher lows in an up trend, OR the successive lower highs in a down trend. The sloping line shows the prevailing direction of the trend in the time-frame covered by the trend line.

Trend Trading / Trend Following
A trading strategy that profits by entering in the direction of the primary trend and then holds onto the trade until the primary trend is over. This strategy is characterized by a large number of small losses and a small number of large winners. Trend following is a stable trading strategy that has worked over a long period of time in many markets. Trend following strategies typically have holding periods from several weeks to several months.
Triangle
Triangles are technical analysis patterns that can appear on bar charts which are created by two opposing trend lines forming a triangle shape on the chart. The downward sloping trendline is like a declining resistance level and the upward sloping trend line is like an upward sloping support level.
These patterns can have some technical analysis value if traded just after the breakout above or below the triangle. A breakout above the triangle in a long term up trend would be viewed as bullish. A breakout below the triangle in a down trending market would be considered bearish.

Value Investing
Value investing is the purchasing of shares in companies that are ‘cheap’ relative to some measure of the underlying value of the company. The valuation can be performed in many ways, and is based on the financial performance and prospects of the company.
Volatility
This refers to how much the price of a stock moves around. More volatile stocks have wider fluctuations in the stock price as a percentage of the price.
Volatility breakout
A volatility breakout (also called a range expansion) is a sharp jump in price. Usually after a period of low volatility, the range of price movements during the trading day expands dramatically so the price appears to ‘break out’ from the previous trading range.
Volatility breakouts can be measured by the distance the current price has moved from the price on a previous day. Frequently we talk about the distance the price has moved in ‘Average True Ranges’, which is a measure of volatility.
For example: “The price has jumped 1.5 Average True Ranges since yesterday’s close”
% Winners / % Losers
Trading systems will have both winning and losing trades. The % winners refers to the percentage of trades you make which are profitable. The % losers refers to the percentage of trades you make which lose money.
While many new traders focus on getting a high percentage of their trades profitable, this is in fact one of the least important components of profitable trading. The expectancy is much more important than the percentage of trades which are profitable.
Worst Case Drawdown
This is the biggest drawdown that you are expected to have given your historical simulations and everything that is likely to go wrong.
I hope this definitive guide to stock market terms has helped you in your efforts to learn stock trading. Please comment below to let me know if there is anything you would like to understand better or any stock trading terms I should add to this guide.
Safe Trading!


Too many words to remember !!
Question :
Gap ?? Gap up / Down
Long side / short side ??
Hi Katsumi,
You don’t actually have to remember every word, you just need to know how to find out what each means when you are reading or watching videos to learn stock trading.
A gap up is when the low of the price bar today is above the high of the price bar yesterday so on the chart there is a ‘gap’ between the two bars.
A gap down is when the high of the price bar today is below the low of the price bar yesterday so on the chart there is a ‘gap’ between the two bars.
Trading on the ‘Long side’ is when you are buying a stock planning to make money by holding the stock while the price rises and then selling later at a higher price to make a profit on the trade.
Trading on the ‘short side’ is when you are aiming to make money as the stock falls in price. You do this by borrowing the stock through your broker and selling it first, and then after the stock price falls you buy it back later at a lower price.
Thanks for your question – please let me know if you need anything further!
Adrian
Thank you Adrian
Are you sleep well ?? reply back to me 2:30 am ??
I written question about positive expectancy & written trading plan, I wonder did I used right channel to ask question ?
Hi Katsumi,
Haha – Yes, I sleep well! I think we must be in different timezones at the moment… or maybe my website thinks I am still traveling 😉
I have seen and replied to your comment on the gaps and the longside/short side in the comments on this post… I see your other question was in the program Facebook group – I will respond to the question there.
Adrian
Hi Adrian
I sent another question on the other channel !!
hope my answer is OK, let you know I am bad in math !!
I have one more request, it is nothing to do with my study, one of my friend said he is interested to take your course !! how is he contact you ?? or can I give you his contact ?
Hi Katsumi,
Thank you for submitting your responses to the assignment for your Beginner’s Guide To Stock Trading course – I will check and reply in the Facebook Group.
Please ask your friend to go to email me adrian @ enlightenedstocktrading.com and I will explain how it all works 🙂
Thanks again!
Adrian
Thank you for your reply.
Hi Adrean
Thank you for your interesting course, I loving it very much.
I d like to asking you simple question regarding Amibroker, I am still unclear what it is.
I also struggle to use system I left some question regarding system !!
I believe I am still far from ready to start trade, you said use system is key to success, I totally agree, I need build more confidence to use system and require better understanding.
I look forward to take next course to learn more about trading, This course is important for my future success, I believe I will make my life better by this opportunity.
I look forward to learn more and understand system better.
I hope your help me get my future plan.
Amibroker is used to export buy and sell signals and Alera Portfolio Manager provides the link between Amibroker and the Interactive Brokers Gateway API. This solution allows complete order execution, portfolio management and automation for end of day trading.
I googled it I got answer I was right !!!
You can certainly use the Alera portfolio Manager to automate trading signals from Amibroker. The first step is to find or develop profitable stock trading systems. Once you have traded for a while and are comfortable with their performance and how they operate then automation can be a useful tool.
Adrian
Thank you
Hi Adrian
I have a question regarding Interactive brokers. I have a Trading Restricted sign when I enter the log in, reason said because account is not funded.
your suggest paper trade, I open the paper trading account, but it say unavailable to trade.
it may be no found in my account.
I believe paper trading give me a great lesson to learn with in the real market.
I wonder do I need put some money in my account for paper trading ??
if it is I wonder how I transfer the money to my account ??
Hi Adrian
I found how to move money.