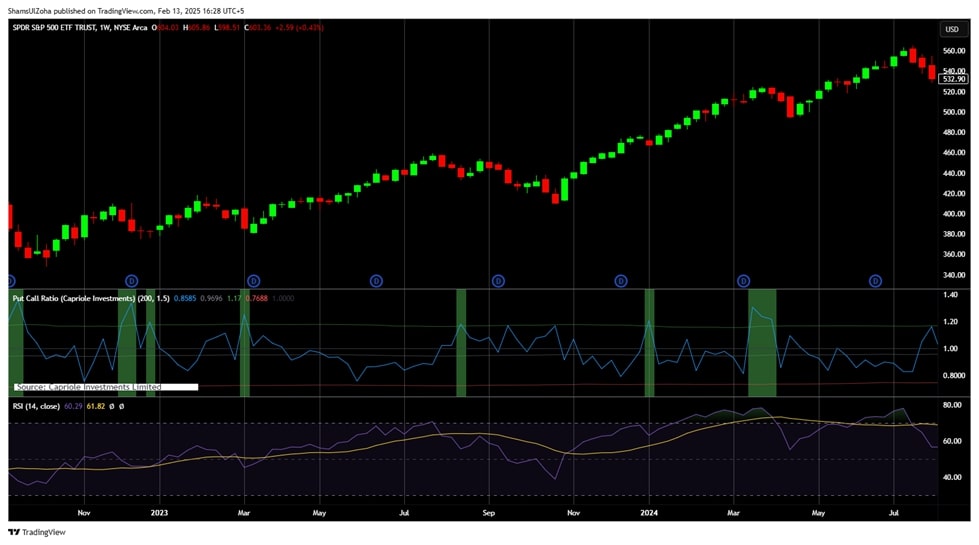
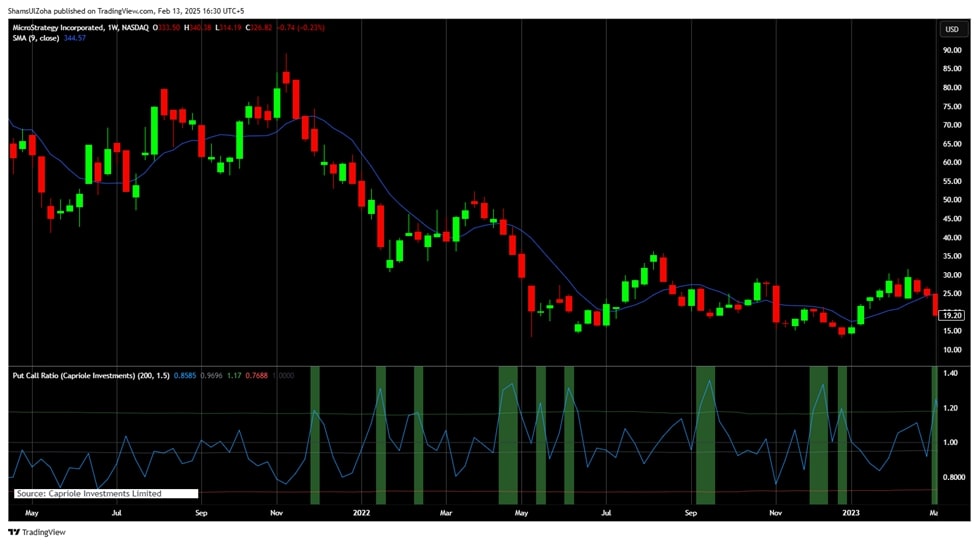
The Put/Call Ratio is a tool commonly used by traders to gauge market sentiment, adding this tool to your trading system may provide the critical edge you need to make your system profitable. The Put/Call ratio offers traders a snapshot of market sentiment based on the volume of traded options.
The put/call ratio is often seen as a contrarian indicator—a lens into the emotional state of the options-trading crowd. When the volume of calls skyrockets to extreme levels, it typically reflects bullish market sentiment.
But here’s the catch: when optimism runs high, savvy contrarian traders start preparing for a pullback. In contrast, when the volume of puts surges, it may suggest panic is peaking—ironically, a bullish signal in disguise. Contrarian investors know that market reversals often occur at these extreme values, especially when the broader market context confirms the shift.
Think of the Put/Call Ratio like the traffic signal of the stock market. Just as a red light tells you to stop and a green light tells you to go, this ratio helps you interpret the prevailing market conditions. If the ratio is high, it’s akin to a red light, suggesting fear and caution in the market; if it’s low, it’s like a green light, signaling optimism and potential upward movement.

For systematic traders, this indicator is incredibly valuable. It provides a measurable, data-driven approach to understanding market psychology, which is critical for executing rule-based strategies.
How the Put/Call Ratio Works in Trading
- Put options give traders the right to sell a stock at a predetermined price, typically purchased when traders are bearish.
- Call options allow traders to buy a stock at a specific price, usually bought when traders are bullish.
For example, if 10,000 puts and 5,000 calls are traded, the Put/Call Ratio would be 2. This indicates a bearish sentiment as more traders buy puts (betting the stock will fall) than calls.
Traders typically use the ratio to assess market sentiment:
- High ratio (above 1): More puts than calls are being traded, signaling a bearish sentiment.
- Low ratio (below 1): More calls than puts, signaling bullish sentiment.

The Put/Call Ratio provides useful information about whether the market is overly pessimistic or overly optimistic, which can help traders decide when to enter or exit trades.
While other sentiment indicators, like the Volatility Index (VIX), also provide clues about market fear or greed, the Put/Call Ratio offers a more direct measure of options market activity.
Systematic Trading Perspective: Why Rules Matter
When incorporating the Put/Call Ratio into a trading strategy, systematic traders rely on objective data interpretation rules. While some discretionary traders might act on gut feelings or interpret the ratio subjectively, rules-based traders are more effective when they use concrete, repeatable steps. For instance, a systematic strategy might involve buying stocks when the ratio falls below 0.7 (signaling bullish sentiment) and selling when it rises above 1.2 (signaling bearish sentiment).
Traders can determine if the Put/Call Ratio adds value to their edge by backtesting this strategy over historical data. If backtesting shows that the strategy is profitable across different market conditions, traders can confidently include it in their trading system.
For example, a trader might combine the Put/Call Ratio with moving averages to refine entries. They could decide to enter long positions when the Put/Call Ratio is low, and the stock is above its 50-day moving average—two signs of a bullish market.
Challenges of Using the Put/Call Ratio in a Trading System
The Put/Call Ratio is a valuable tool for gauging overall market sentiment by comparing the number of put options (which reflect bearish sentiment) to call options (which reflect bullish sentiment). However, it’s not the only indicator traders rely on. Let’s explore how the Put/Call Ratio compares to three other common indicators.
1. Relative Strength Index (RSI)
RSI tracks price momentum directly and is more price action-based, providing insights into the current market conditions. It reflects what is happening now rather than what investors anticipate through options trading. While the Put/Call Ratio is forward-looking and driven by sentiment, RSI focuses more on present price movements.

2. Moving Averages (MA)
Moving Averages (MA) provide insights into a market’s trend direction over time, while the Put/Call Ratio serves as a sentiment gauge, reflecting whether the market is overly pessimistic or optimistic. MA indicators are based on historical price data, whereas the Put/Call Ratio is forward-looking and driven by investor expectations reflected in options trading activity.

3. Bollinger Bands
Bollinger Bands are volatility-based, focusing on market conditions and the likelihood of price reversals. At the same time, the Put/Call Ratio is sentiment-driven, highlighting potential market shifts based on options market activity. While Bollinger Bands provides insights into overbought and oversold conditions based on price movement, the Put/Call Ratio does not offer direct price action signals but focuses on trading psychology.

Actionable Tips for Using the Put/Call Ratio Effectively
Momentum Strategy
When the ratio is below 0.7, indicating bullish sentiment, combine it with other indicators like moving averages to enter long trades. Conversely, consider shorting stocks or adopting a defensive strategy when the ratio rises above 1.2, indicating bearish sentiment.
Market Conditions
The Put/Call Ratio works best in trending markets (bullish or bearish). It’s less effective in sideways or choppy market conditions, where sentiment shifts quickly. Consider using additional indicators to confirm your decisions if trading in a volatile or range-bound market.
Use as a Confirmation Tool
Don’t rely solely on the ratio to make decisions. Instead, use it alongside other systematic trading rules (such as price action or trend-following strategies) to confirm market direction.
Monitor Over Time
Keep an eye on the Put/Call Ratio over extended periods to identify shifts in sentiment. Sudden spikes or dips can signal upcoming market trends and changes, helping you position your trades in advance.
On any given trading day, the put/call ratio provides a snapshot of how options traders are positioning themselves. But it’s not enough to rely on one day’s reading. Successful traders observe the time period—or better yet, a rolling time frame—to filter out noise and focus on patterns. If the ratio climbs steadily during a bull market, it may be signaling growing caution—potentially a contrarian signal. In contrast, during a bear market, sudden optimism among the options crowd may actually be a bearish signal, warning of another leg down.
Conclusion
In conclusion, the Put/Call Ratio is a powerful tool for understanding market sentiment and predicting potential shifts. Comparing the number of puts to calls enables traders to assess whether the market is excessively bearish or overly bullish, providing valuable insight into forthcoming market conditions.
Keep in mind, though, this isn’t a standalone magic wand. The put/call ratio should be used alongside momentum oscillators, trading volume, and data like outstanding calls from the previous market day. Many momentum investors get caught on the wrong side of the trend by ignoring the psychology embedded in the options contracts. The ratio’s bleak record as a short-term timing tool improves when viewed through the lens of a neutral trend or used in combination with reliable indicators. Like all tools, its usefulness depends on the editorial policy of your trading system. That’s what separates the dabblers from the successful traders.
When used with other technical indicators such as the RSI, Moving Averages, and Bollinger Bands, the Put/Call Ratio offers a more comprehensive perspective on the market, giving traders an advantage in making informed trading decisions.
If you’re ready to elevate your trading skills and effectively apply systematic strategies like the Put/Call Ratio, consider learning through The Trader Success System. With our step-by-step guidance, you’ll acquire the tools and confidence to trade systematically, ensuring you make smarter decisions and achieve consistent profits. Apply today and discover the impact systematic trading can have on your success.
Types of Trading Indicators
To explore the most effective technical tools for systematic traders and learn how to apply them with precision, visit our Trading Indicators page for a comprehensive breakdown.
- Trading with Percentage of Stocks Above Moving Average Made Easy
- Hurst Cycles Explained: Unlock the Secrets of Market Timing
- How to Use Fibonacci Time Zones for Smarter Trade Timing
- Guppy Multiple Moving Average (GMMA): How to Trade Trends with Confidence
- High-Low Index Explained: A Simple Tool for Market Trends
- How to Use the Gann Fan in Systematic Trading
- How to Properly Interpret Bullish Percent Systematic Trading
- Money Flow Index: Boost Your Trading Edge
- Triple Exponential Average: A Smarter Way to Track Trends
- Demark Pivot Points: A Proven Tool for Market Timing
- Envelope Indicator: A Complete Guide for Systematic Traders
- Accumulation/Distribution Indicator: How to Spot Smart Money Moves in the Stock Market
- Awesome Oscillator: A Powerful Tool for Spotting Trend Changes
- How to Trade with Heikin-Ashi Candlesticks Like a Pro
- Master the Standard Deviation Indicator for Better Trades
- How to Use the Vortex Indicator in Systematic Trading
- How to Use Chaikin Money Flow for Smarter Systematic Trading
- Time Cycles in Trading: How to Identify Market Timing Patterns
- How to Trade Better with the Advance/Decline Line
- Master the Elliott Wave Indicator for Profitable Trades
- Unlock Market Trends with the Rate of Change Indicator
- How to Trade Better with the Put/Call Ratio
- How to Use the Ichimoku Cloud Indicator for Profits


