The financial markets can feel pretty chaotic and random at times, but within all of the chaos, there is order, and there are anomalies in price action that can be traded profitably – Turnaround Tuesday is one such market anomaly. This article explains the ‘Turnaround Tuesday’ trading strategy, quantifies the edge with backtested potential trading strategies and demonstrates the results from my special variation on this trading strategy, which generates substantially stronger returns than the basic approach.
Turnaround Tuesday is a stock market term used to describe a trading strategy that capitalizes on the market’s tendency to reverse short-term corrections on Tuesday. This is an example of a seasonal mean reversion trading strategy that, if applied consistently with good risk management, could generate quite positive returns with very little time and effort, as we will see in the analysis below.
The basic rules of the Turnaround Tuesday strategy involve buying an index ETF, such as the SPY (the largest ETF for the S&P 500 Stock Market Index), at the close of trading on Monday or the open of Tuesday and holding it until the close on Tuesday. The strategy only purchases when Monday was a down day, because after a down Monday there is a tendency for Tuesday to be a recovery day (or turnaround day)… thus the name of the strategy.
There are several ways to implement rules to capture this price action anomaly, I have shared several approaches below and then at the end of this article shown you my own personal T3 Strategy for turbocharging the profit potential of the Turnaround Tuesday trading strategy.
Does the Turnaround Tuesday trading strategy work?
Like any trading idea, we need to backtest it to answer the question ‘Does the Turnaround Tuesday trading strategy work?’. In this section, we will be backtesting several strategies based on this popular trading approach using Amibroker. Our aim is to provide you with the backtest results that not only validate the presence and persistence of the Turnaround Tuesday edge and how to implement it into your own portfolio.
To put this theory to the test, we will evaluate the strategy when applied to the SPY ETF historical data and analyze the performance using a backtest in Amibroker.
Turnaround Tuesday trading strategy #1
The most basic rules for the Turnaround Tuesday trading strategy are as follows:
- Buy the SPY ETF on the close of trading on Monday if the close is lower than the open
- Exit positions in the SPY ETF at the close of trading on Tuesday (no other exits)
- Invest 100% of the capital allocated to the strategy in each trade
Trading strategies don’t get much simpler than this, but is it profitable?
We have backtested this strategy in both Amibroker and WealthLab to see how profitable and consistent the strategy is.
Let’s backtest this trading strategy and see how profitable it is… here is the equity curve and drawdown profile in Amibroker:

… and here it is in Wealth-Lab 8. The results vary slightly with some different assumptions for commissions but the backtests are closely aligned:

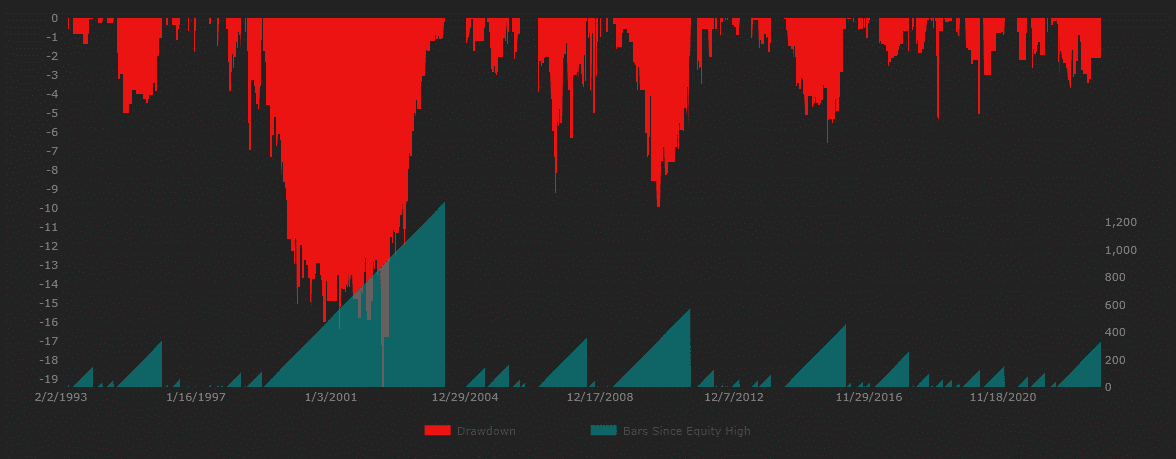
On face value this looks like quite a promising trading strategy:
- Annual Return: 4%
- Exposure: 4%
- Risk Adjusted Return: 9%
- Max Drawdown: 6%
- CAR/MDD: 0.23
- Average Profit Per Trade: 0.22%
That is until we get to the average gain per trade which is just 0.22%. This initial backtest was performed assuming no allowance for slippage and commissions, which is quite optimistic. Given that the average profit per trade is so low, I would expect that performance would be much worse once the backtest is made with realistic assumptions for slippage and commission.
The slippage and commission assumptions for the Turnaround Tuesday strategy can be fairly modest because this is one of the most liquid instruments listed on the stock market. You may be able to get commission free trading depending on your location and broker but I feel it best to allow some amount just to be more realistic in our backtesting assumptions. I will assume the commission rate 0.8% of the value of the trade.
Here is what happens to the strategy once you include even this low commission rate:
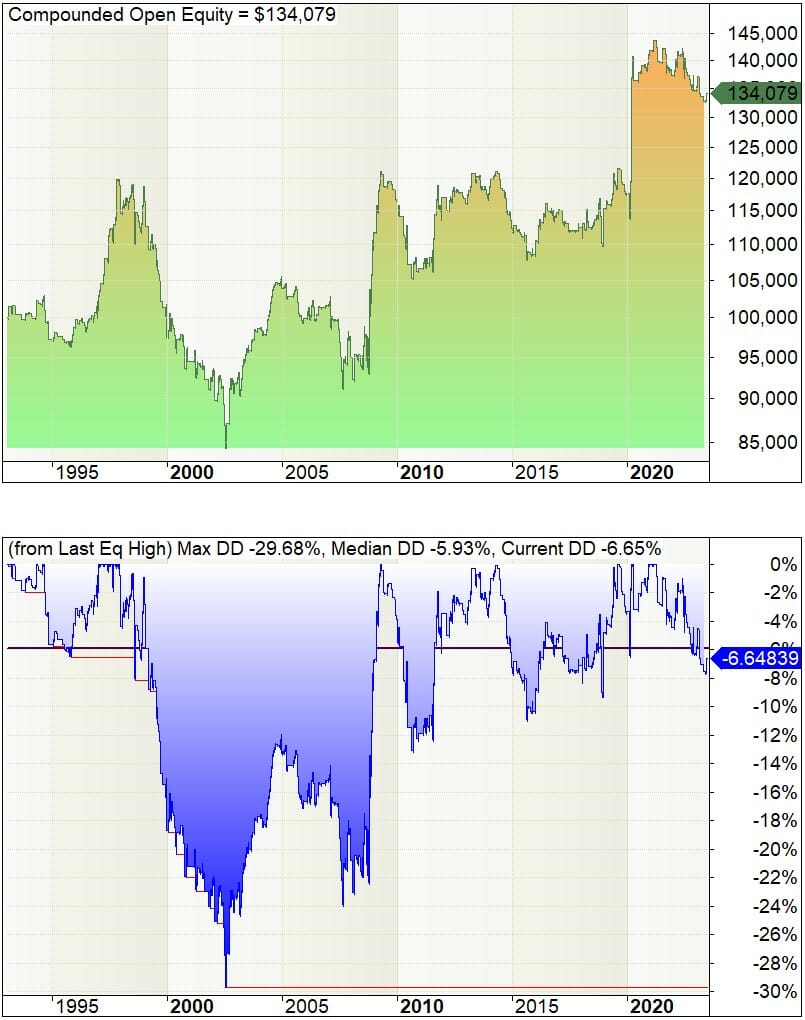
Oops – not so attractive now! This demonstrates the importance of including an allowance for slippage and commission in your backtests so you are not fooling yourself.
Don’t give up hope just yet, let’s investigate some adjustments to the strategy to see what we can achieve.
Turnaround Tuesday trading strategy #2
The second turnaround Tuesday trading strategy is a slight adjustment of the first which requires that the SPY has fallen for two consecutive days from the close of one day to the close of the next. Here is the logic:
- Buy the SPY ETF on the close of trading on Monday if the close is lower than the close on the previous Friday and the close on the previous Friday is lower than the close on the previous Thursday
- Sell the SPY ETF at the close of trading on Tuesday (no other exits)
- Invest 100% of the capital allocated to the strategy in each trade
The results (including an allowance for commissions) are positive but still not exciting. Here they are in an Amibroker backtest:
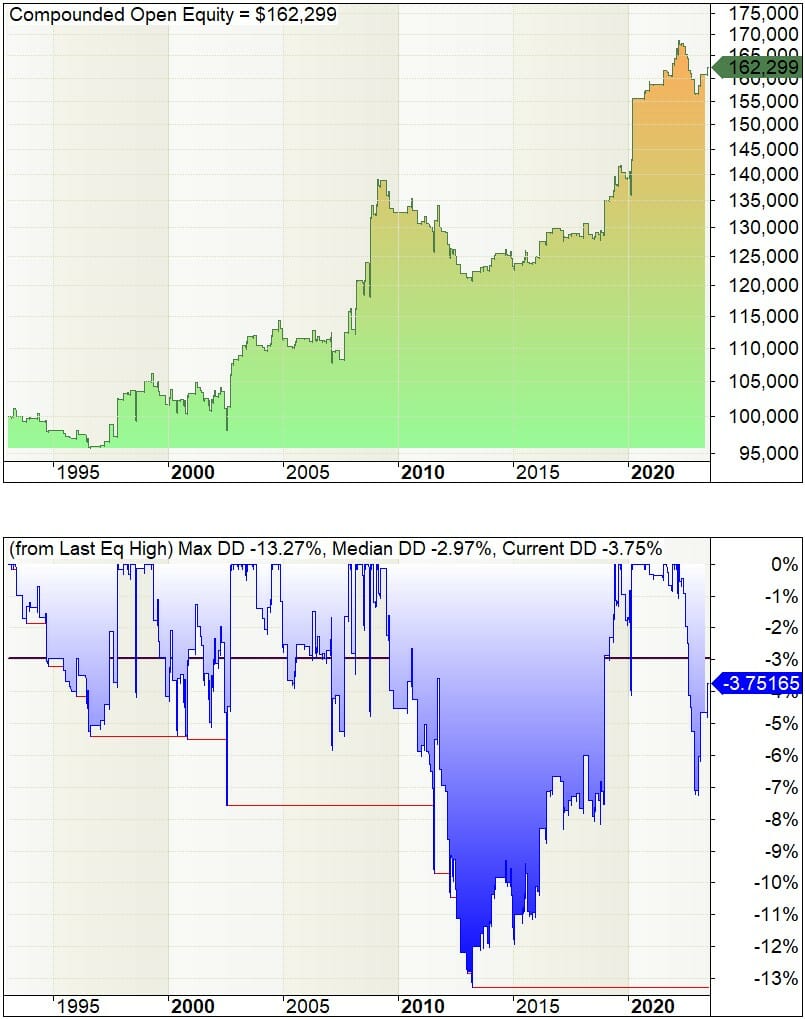
- Annual Return: 1.6%
- Exposure: 3.6%
- Risk Adjusted Return: 45.0%
- Max Drawdown: 13.3%
- CAR/MDD: 0.12
- Average Profit Per Trade: 0.19%
After taking into account commissions this has increased the average gain per trade, so we are moving in the right direction, but not many traders will get excited about these backtested returns. Let’s try another adjustment to the trading strategy.
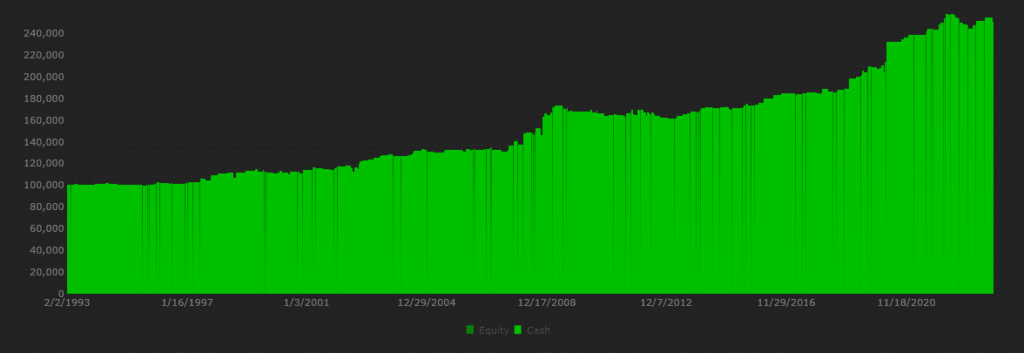
Here is another example of the equity curve and drawdown profile for this second Turnaround Tuesday strategy backtested in WealthLab 8. There are some slight differences from the Amibroker version, however this shows that there are some great features in WealthLab 8 likd the time between equity highs in the drawdown chart below.

Turnaround Tuesday trading strategy #3
Since we are talking about capturing a turnaround in stockmarket direction, let’s test the idea of only trading the Turnaround Tuesday strategy when the SPY is trending down in a bear market. Hopefully this will allow us to capture a bigger turnaround and improve our results. Here is the logic:
- Buy the SPY ETF on the close of trading on Monday if
- the close is lower than the close on the previous Friday AND
- the previous Friday’s close is lower than the previous Thursday’s close AND
- the close today is less than the previous bar’s 50 period moving average
- Sell the SPY ETF at the close of trading on Tuesday (no other exits)
- Invest 100% of the capital allocated to the strategy in each trade
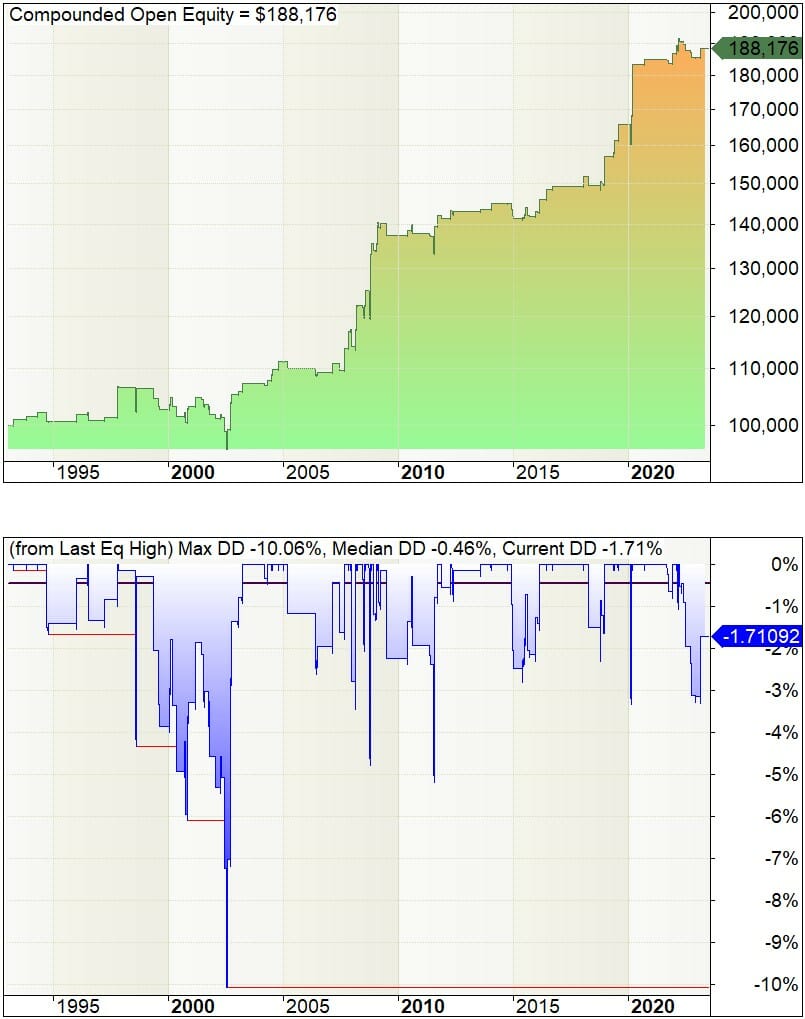
The results (including an allowance for commissions) have improved further and we have managed to reduce the drawdown as well. Here is the equity curve in SPY backtesting with Amibroker:
And here is the same system backtested in WealthLab 8:

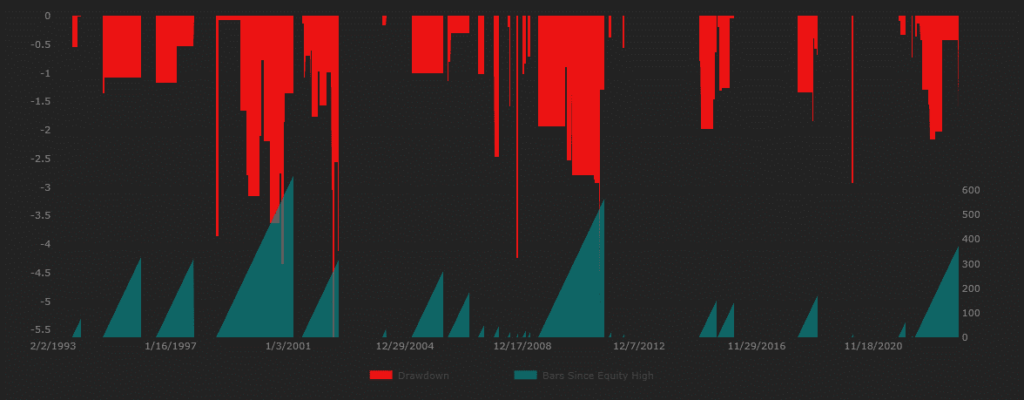
- Annual Return: 2.1%
- Exposure: 1.8%
- Risk Adjusted Return: 116%
- Max Drawdown: 10.1%
- CAR/MDD:0.21
- Average Profit Per Trade: 0.48%
The risk adjusted return is really starting to look interesting now, but the annual return is still only 2% and is low relative to the maximum historical drawdown. Plus this is even more interesting because it is a way to profit on the long side in a bear market.
From what we have seen with these 3 simple trading strategies based on the Turnaround Tuesday anomaly, it is clear there is a market edge available, but in this raw form it is not a terribly exciting strategy to trade… but we can improve it further and make it a very compelling trading strategy (read on…)
Does Turnaround Tuesday only work if Monday was a down day?
I am always curious if patterns like this are real of just some artifact of the data. The core premise of this strategy is if Monday is down, then Tuesday is likely to be up. So let’s try buying at the close on Monday if Monday is an up day (and keep all other rules the same as strategy #3 above… here is what happens:

This shows that reversing the requirement for Monday to be a down day turns this edge into a loss making proposition – So there really is something in the ‘Turnaround’ part of ‘Turnaround Tuesday’. But what about other day’s of the week?
The Rest of the Week
In this section, I will test whether the ‘Tuesday’ is important in the ‘Turnaround Tuesday’ strategy by removing the requirement to enter only on Monday’s close and test entering on each day of the week provided the close was below the previous close for two day’s in a row and the close is below the 50 period moving average. We will continue exiting at the close of the following day. Here are the results:

This analysis shows that entering at the close on Monday (and holding until Tuesday’s close) is by far the best day of the week. This demonstrates that there is indeed something significant in the ‘Tuesday’ part of the ‘Turnaround Tuesday’ strategy.
Turbocharging the Turnaround Tuesday Trading Strategy
As you have seen, the Turnaround Tuesday trading strategy does indeed give you an edge in the markets. However this edge is small and the returns from trading the basic strategy are small. If you want real long term gains, you will need some extra secret sauce…
Based on the Turnaround Tuesday Trading Strategy with a small number of elegantly simple tweaks, we have developed a trading strategy with much more impressive results. With just two simple changes we have developed the T3 Strategy. Our strategy’s performance is dramatically improved compared to the simple Turnaround Tuesday strategy and are extremely attractive:
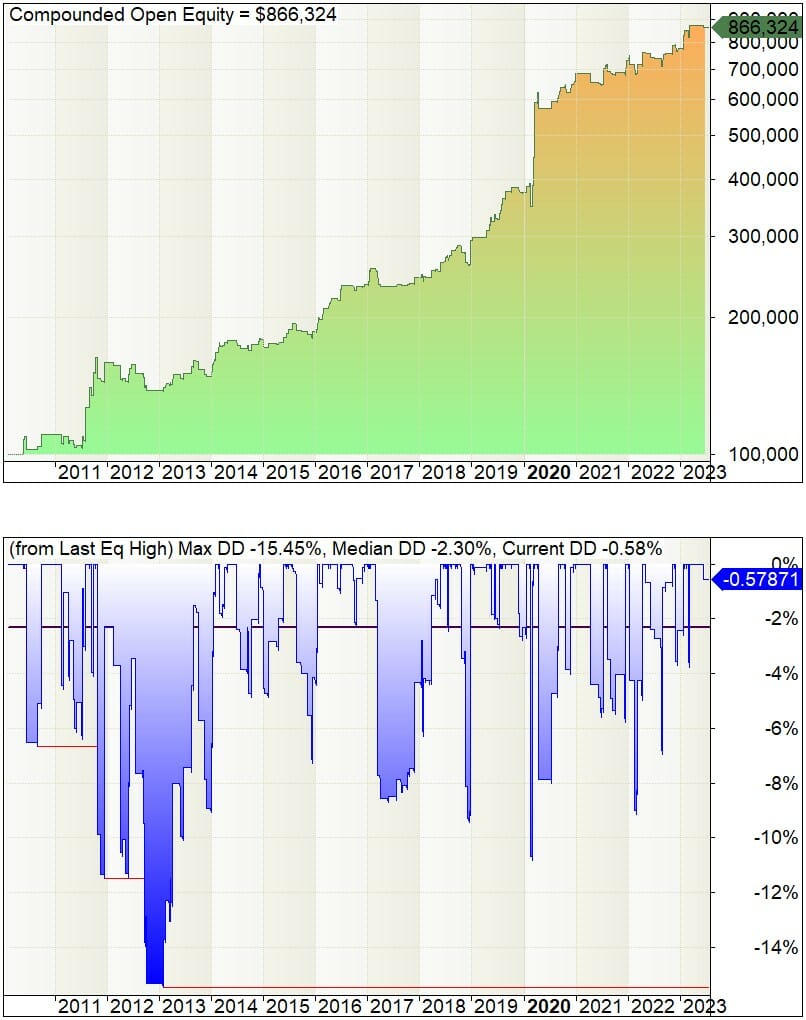
- Annual Return: 17.4%
- Exposure: 6.2%
- Risk Adjusted Return: 282%
- Max Drawdown: 15.5%
- CAR/MDD: 1.12
- Average Profit Per Trade: 1.13%
This trading strategy has some unique features worth highlighting:
- Time: Forget the constant monitoring. The T3 Strategy takes less than 5 minutes a week to manage your trades, freeing up your precious time.
- Software: Don’t want to learn or use trading software? No problem – You can seamlessly implement the T3 Strategy without software with any broker that enables US Stock trading.
- Coding: The trading rules are elegantly simple and don’t need coding. The logic is 100% objective and can easily be seen on only chart. Of course I also give you the code for Amibroker and WealthLab just in case you want it😉
- Complexity: The T3 Strategy thrives on simplicity – and that’s where its power lies. The rules are so simple my dog could implement it (well not quite but you get the picture)
- Over Optimization: Over-optimization can be a silent profit killer. With the T3 Strategy, there are zero parameters to optimize, eradicating the risk of over-optimization!
- Experience: No prior algo or systematic trading experience is required
- Capital: Since this is a single instrument system, you can trade it even if you only have a small account
The T3 Strategy capitalizes on a long-standing and well-documented seasonality pattern that potentially gives us one single trade each week on a single ETF.
What could be easier to manage than that?
Our backtesting demonstrates an impressive 17% compound annual return, investing only 6% of the time, and a maximum historical drawdown of just 15.5%. With a staggering Risk Adjusted Return of 281%, this strategy is a heavyweight champion in a lightweight package.
Conclusion: The Tuesday Turnaround effect
In conclusion, the Tuesday Turnaround effect is a well-known phenomenon in the stock market that refers to the tendency of the market to experience a reversal or bounce back on Tuesdays after a negative Monday.
This market anomaly presents an opportunity for short term gains on a regular basis, however on it’s own the size of the edge is small and not likely to appeal to many traders. However, with a few elegant tweaks, as we have demonstrated in the T3 Strategy, we can use this market anomaly to generate substantial and exciting results.
Frequently Asked Questions about the Turnaround Tuesday Strategy
What is Turnaround Tuesday?
Turnaround Tuesday is a trading strategy that involves taking advantage of Monday’s market decline by going long on stocks expecting a rebound on the following Tuesday. This strategy is based on the observation that Tuesday has historically shown a higher probability of positive gains compared to other trading days when Monday is a down day.
Is ‘Turnaround Tuesday’ a Real Thing?
You bet it is! We have backtested several approaches to trading the Turnaround Tuesday anomaly and shown it to be profitable in backtesting. The T3 Strategy, developed by Enlightened Stock Trading to capitalize on the anomaly has shown backtested returns in excess of 17% per annum while only being invested 6% of the time – This is a risk adjusted return of 282% pa!
Does the Turnaround Tuesday trading strategy work?
Yes, the Turnaround Tuesday trading strategy has shown promising results based on the analysis conducted. This particular strategy involves buying stocks on Monday and selling them on Tuesday, capitalizing on the potential market anomalies and inefficiencies that tend to occur during this specific trading day.
The analysis reveals that Turnaround Tuesdays have consistently offered positive returns, with an profitable average gain per trade after commissions. The base strategy needs to be improved to make it a compelling inclusion in your portfolio, however the T3 Strategy has made this possible for all traders.
How does Turnaround Tuesday work?
The concept behind Turnaround Tuesday is to capitalize on market inefficiencies and anomalies that often see stocks experiencing a dramatic turnaround after the bearish sentiment of the previous day.
How can I implement the Turnaround Tuesday trading signals?
If you’re interested in implementing Turnaround Tuesday trading signals, the best way to do this is to purchase the T3 Trading Strategy which can be implemented in less than 5 minutes a week with no software or data subscription. All you need is a brokerage account which allows you to trade US ETFs.
How can I access the Turbo Turnaround Tuesday Trading Strategy?
If you’re looking to access the Turbo Turnaround Tuesday Trading Strategy, all you need to do is click the button below and purchase the strategy. By doing so, you will gain access to the EST Trading Strategy Hub, where you can find detailed information and instructions on how to implement this profitable trading strategy. The T3 Strategy offers a simple yet effective approach to navigating the stock market for beginners and advanced traders alike. So, if you’re ready to make the most out of this profitable and reliable trading technique, click the button below now and gain access to the T3 Strategy today!
Can the T3 Strategy be automated using the Smart Stock Automation Engine?
Yes! When you gain access to the T3 Strategy you will also receive the code to implement this strategy using the EST Smart Stock Automation Engine (for subscribers to The Smart Stock Automation Engine Only).





I am guessing that the T3 strategy in automation mode will require a data subscription – is that a correct assumption?
Hi Richard,
Yes that is correct. If you want to automate it with The Smart Stock Automation Engine then you will need Amibroker and an active US data subscription from Norgate or similar data provider.
If you don’t have that then you would just follow the instructions in The Trading Strategy Hub which you can do any time over the weekend.
Adrian