Everyone says buy the dip. And if you have ever acted on it, I would guess it has hurt you in at least one of the two ways it can.
The first time, the stock was down 30% and looked cheap. It went to 60% down and you held on, hoping to get back to even. The next time you were careful. You waited for the right dip, and when it came it looked exactly like the wrong one, so you let it pass. A month later it was up 25% without you.
Both mistakes had the same cause: two falling stocks look identical on a chart. Both are down 30%, both have bad headlines. One has a seller who is about to stop selling. The other is going to zero. Nobody can tell them apart by looking, including the people on financial TV who confidently tell you which is which.
So “buy the dip” has cost you in both directions, and it will keep costing you, because nothing about it is written down. Which stock, why it fell, when to buy, how much, when to give up. Every dip becomes a fresh decision made under pressure. That is discretionary trading: a new judgement call every time, and inconsistent results to match. In 2022 the S&P 500 fell from January to October and almost every dip kept falling. By the time the low arrived, most dip buyers had run out of cash, nerve, or both.
In this article I will show you one dip that bounced and one that did not, what told them apart, and what one rules-based system did through 2008 and 2022 while the index fell. Then I will show you how the system works, and where to get the exact rules and the code for free.
Get the Index Exile Bounce Rules + Code (Free)
What Happens to Stocks Removed From the S&P 500?
Index funds are forced to sell them, usually within days, whatever the price.
When the S&P 500 committee removes a company from the index, every fund that tracks the index has to sell it. Those funds have no view on the business. Their mandate is to hold what is in the index, and the company no longer is.
That makes it the one dip where you know who is selling and why. I built a systematic strategy to buy it, and I call it the Index Exile Bounce. An “exile” is a company that has just been removed from the index. The system waits a short while after the removal, checks the company is still trading normally and is large and liquid enough to trade, and buys. The profit target, the stop and the time limit go in the same day. When there is no exile to buy, it sits in cash.
Seven rules, four to buy and three to sell. 239 trades in almost thirty-two years, about seven a year. The exact rules and the code are free through the link at the end of this article, because the system teaches what “buy the dip” never does: what a dip with a known seller looks like, and what to do with the ones that keep falling anyway.
All figures in this article are hypothetical backtest results on a US dollar account, after commission and slippage, from 3 January 1995 to 28 October 2026.
The Dip That Bounced
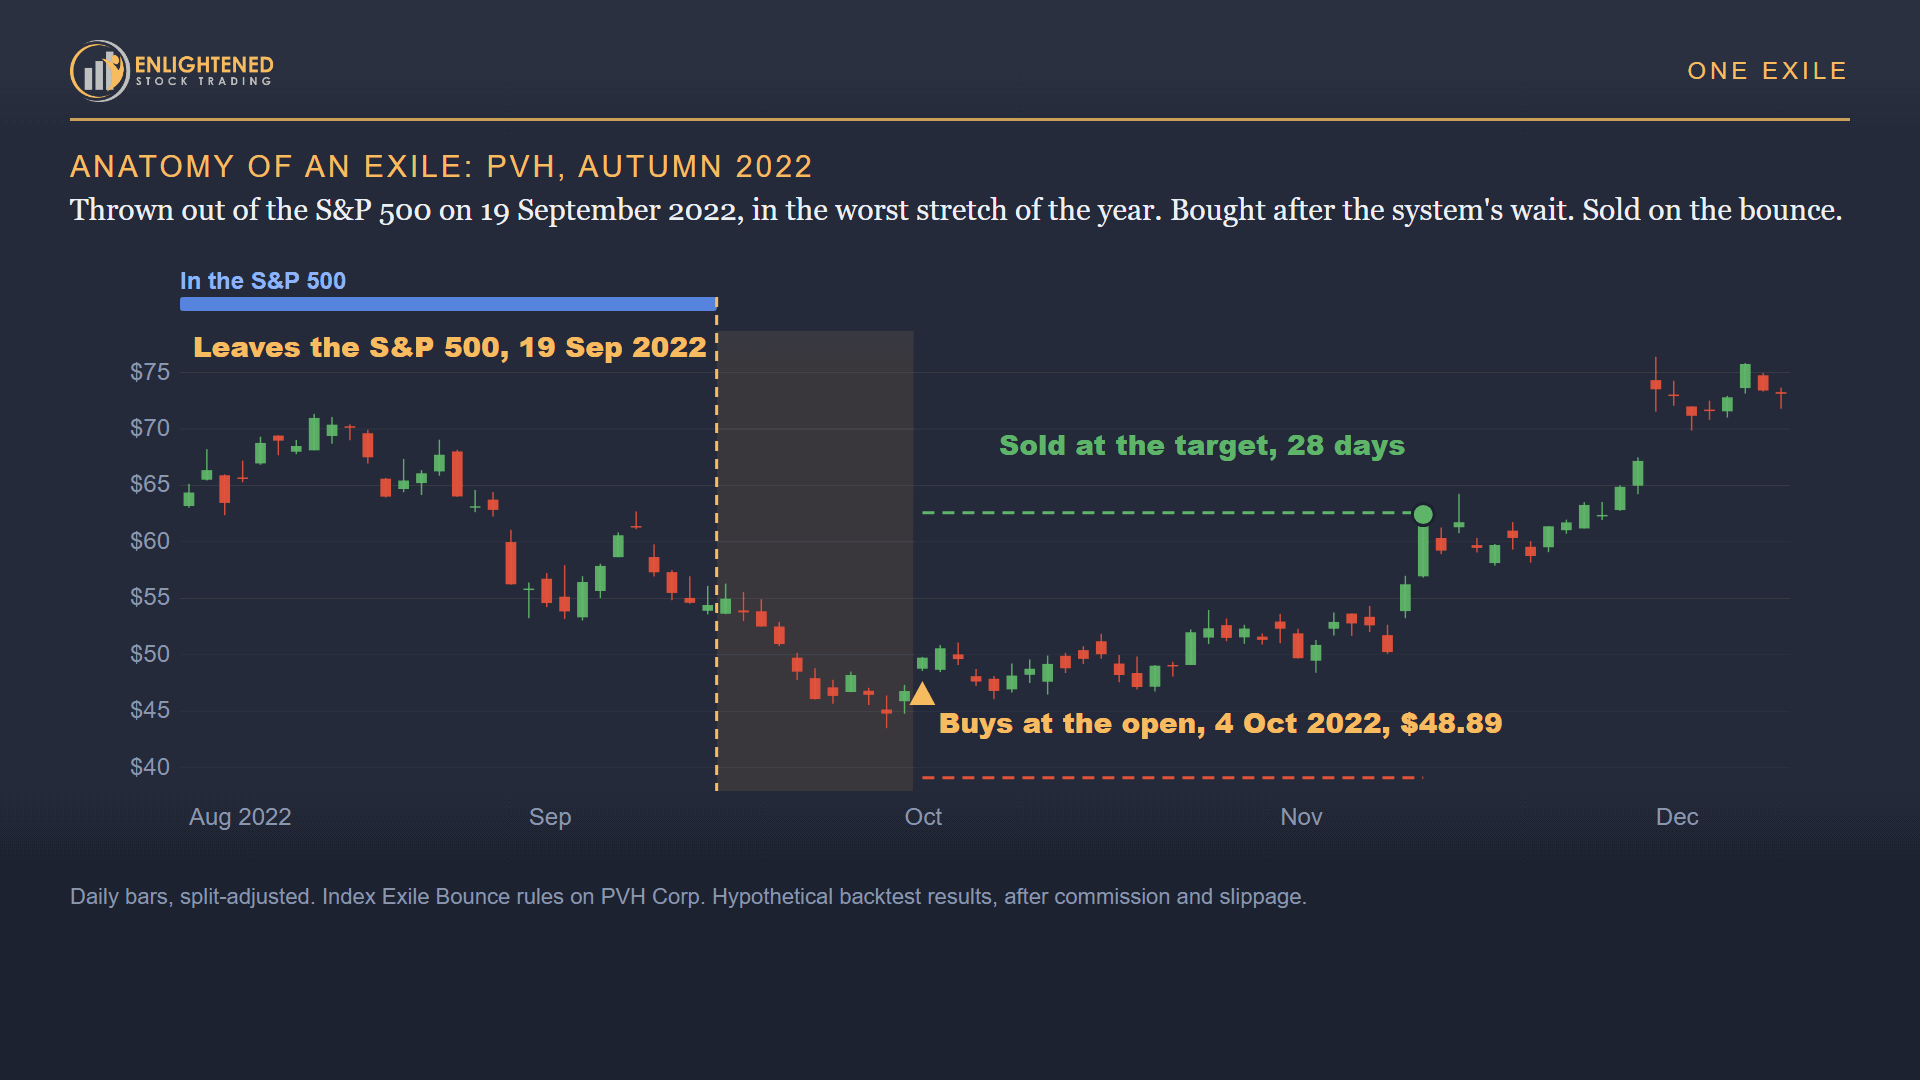
On 19 September 2022 PVH, the clothing company, was removed from the S&P 500. The stock had already halved that year. Every index fund that held it had to sell. On any other day it was the kind of dip that has burned you before: a falling stock with bad news.
On 4 October it bought at the open at $48.89 and placed the target and the stop. On 11 November, 28 trading days later, the target was hit. Penn Entertainment, removed on the same day in September, did the same thing three days later.
The S&P 500 made its 2022 low six trading days after those buys. The system had no way of knowing the market was about to bottom. It bought because the forced selling was over, which is the only thing its rules check.
The Dip That Did Not Bounce
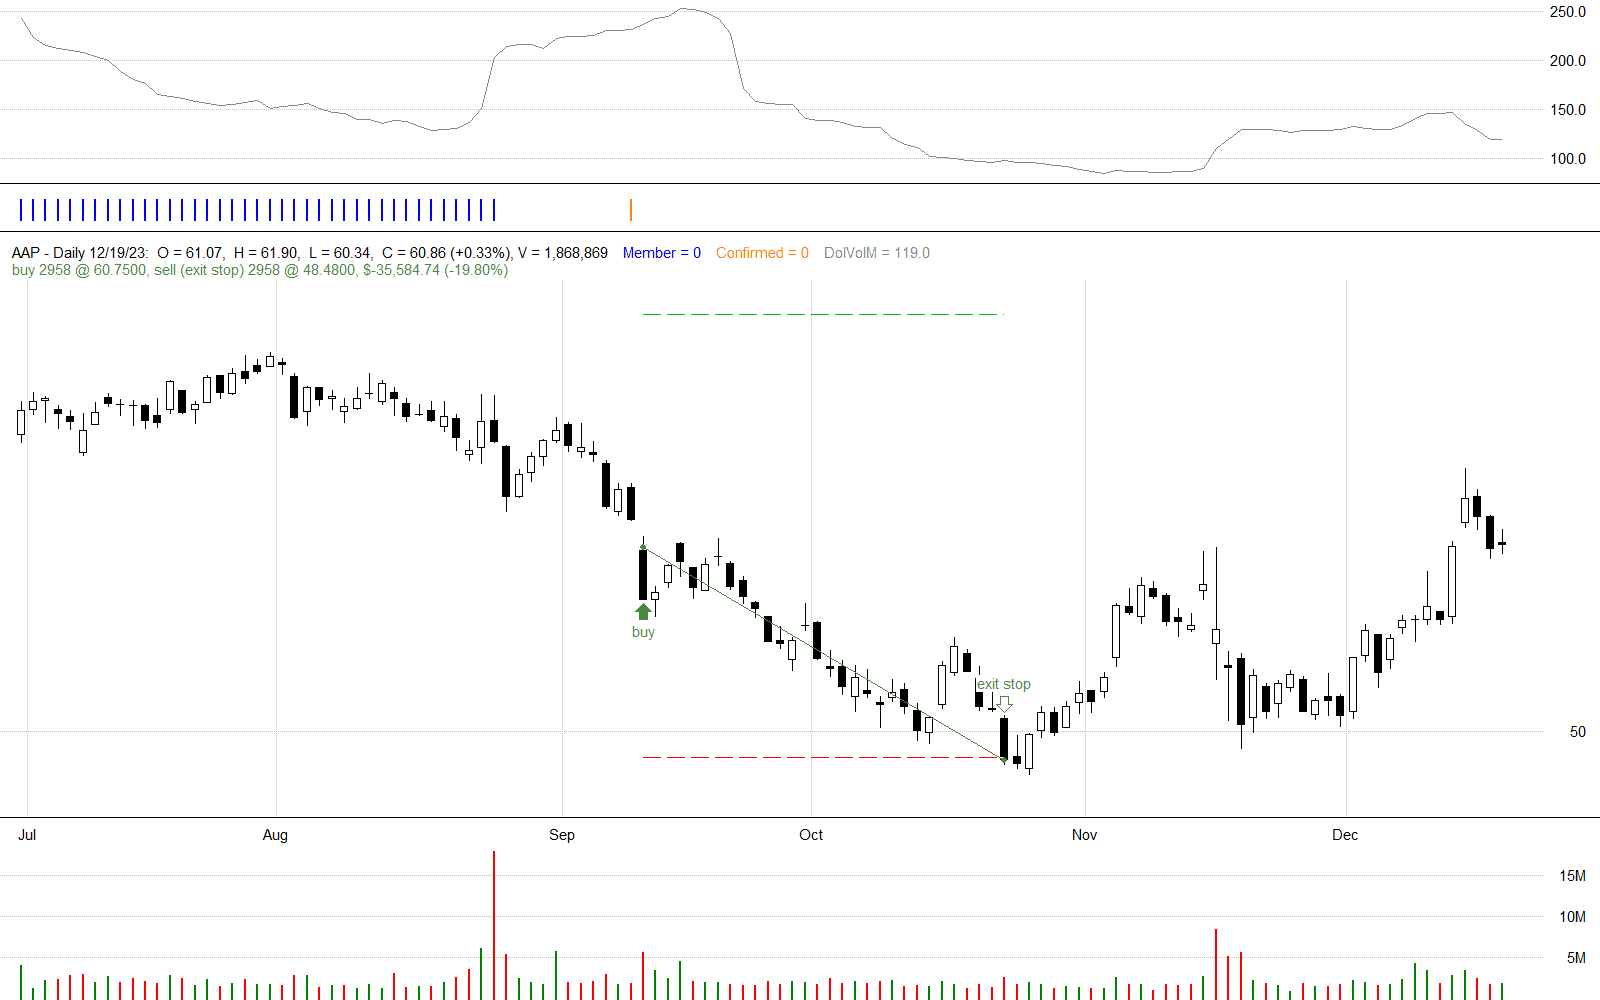
Advance Auto Parts left the index in August 2023. Same rule, same entry. It kept falling for six weeks, hit the stop, and recovered later without us.
On the day of entry, its chart and the PVH chart looked the same. The system could not tell them apart either. What it did have was a stop order sitting with the broker from day one, so when the price hit that level there was nothing to decide. No “give it one more week”. No averaging down.
One trade in five ends this way, 48 trades over thirty-two years. Another 61 ran to the full profit target, and 109 were sold at the time limit for an average gain of 5.1%. Those 48 stops are what it costs to buy every qualifying dip instead of guessing which one will bounce.
How Does the Index Exile Bounce Work?
It buys large, liquid companies a fixed number of days after they leave the S&P 500, and sells at a fixed profit target, a fixed stop or a time limit, whichever comes first.
The exact values are in the download, with the code. What follows is what each rule is for.
The universe is every company that has ever been in the S&P 500, delisted companies included, with historically accurate index membership on every day of the test (Norgate Data’s “S&P 500 Current & Past” list). Without that day-by-day membership history, you cannot test this idea at all.
What It Buys
- The event. The company has just been removed from the S&P 500: a member one day, not a member the next. Nothing else gets the system’s attention.
- The wait. It does not buy on the day of removal. It waits a fixed number of trading days, and the company must trade normally every day of that wait. This is the quality filter. Companies leave the index because they shrank, were taken over, or are failing. A company being acquired stops trading, and a collapsing company usually fails the next rule.
- A price floor and a turnover floor. The share price must be above a minimum, and the stock must trade a minimum dollar value each day. This keeps out the shares left trading after a takeover or collapse, and stocks too thin to trade in size.
If all of that is true at the close, it buys at the next open.
What It Sells
Three orders go in with the broker on the day of entry, and the first one hit ends the trade:
- A fixed profit target above the entry price, filled intraday. This is the most valuable rule in the system, because it banks the bounce before it fades.
- A fixed stop below the entry price, filled intraday. It caps the losses on the ones that keep falling.
- A time limit. If neither level is hit within a set number of trading days, the position is sold at the next open. This is a risk rule. The system makes more money without it, but its worst drawdown is far deeper.
There is no market filter, no re-entry rule and no trailing stop.
How It Is Sized
A fixed fraction of equity per position, a hard cap on the number of open positions, and no leverage. When more exiles qualify than there are free slots, a short-term momentum ranking decides which are bought first. Commission and slippage are charged on every trade.
I put every rule through our full backtesting process on the development data from 1995 to 2017: optimisation, tests for statistical significance, and robustness stress-testing. Every rule that survived earns its place, and one of them, the daily-trading check inside the wait, changed no trade in the test and is kept as insurance against a company that stops trading during the wait.
The wait is the rule that looks odd, as if the system is giving up the best price. It gives up very little. The forced selling is finished by the time the company leaves the index, and the drift back up has not started yet.
Where Does the Edge Come From?
It comes from forced selling. Index funds must sell a deleted company within days, and that pushes the price below what the business is worth to ordinary buyers.
Trillions of dollars track the S&P 500. When the committee deletes a company, those funds sell their whole holding within a few days, with no view on the business. The price is pushed below where ordinary buyers value the company. Once the forced sellers are done, the price drifts back.
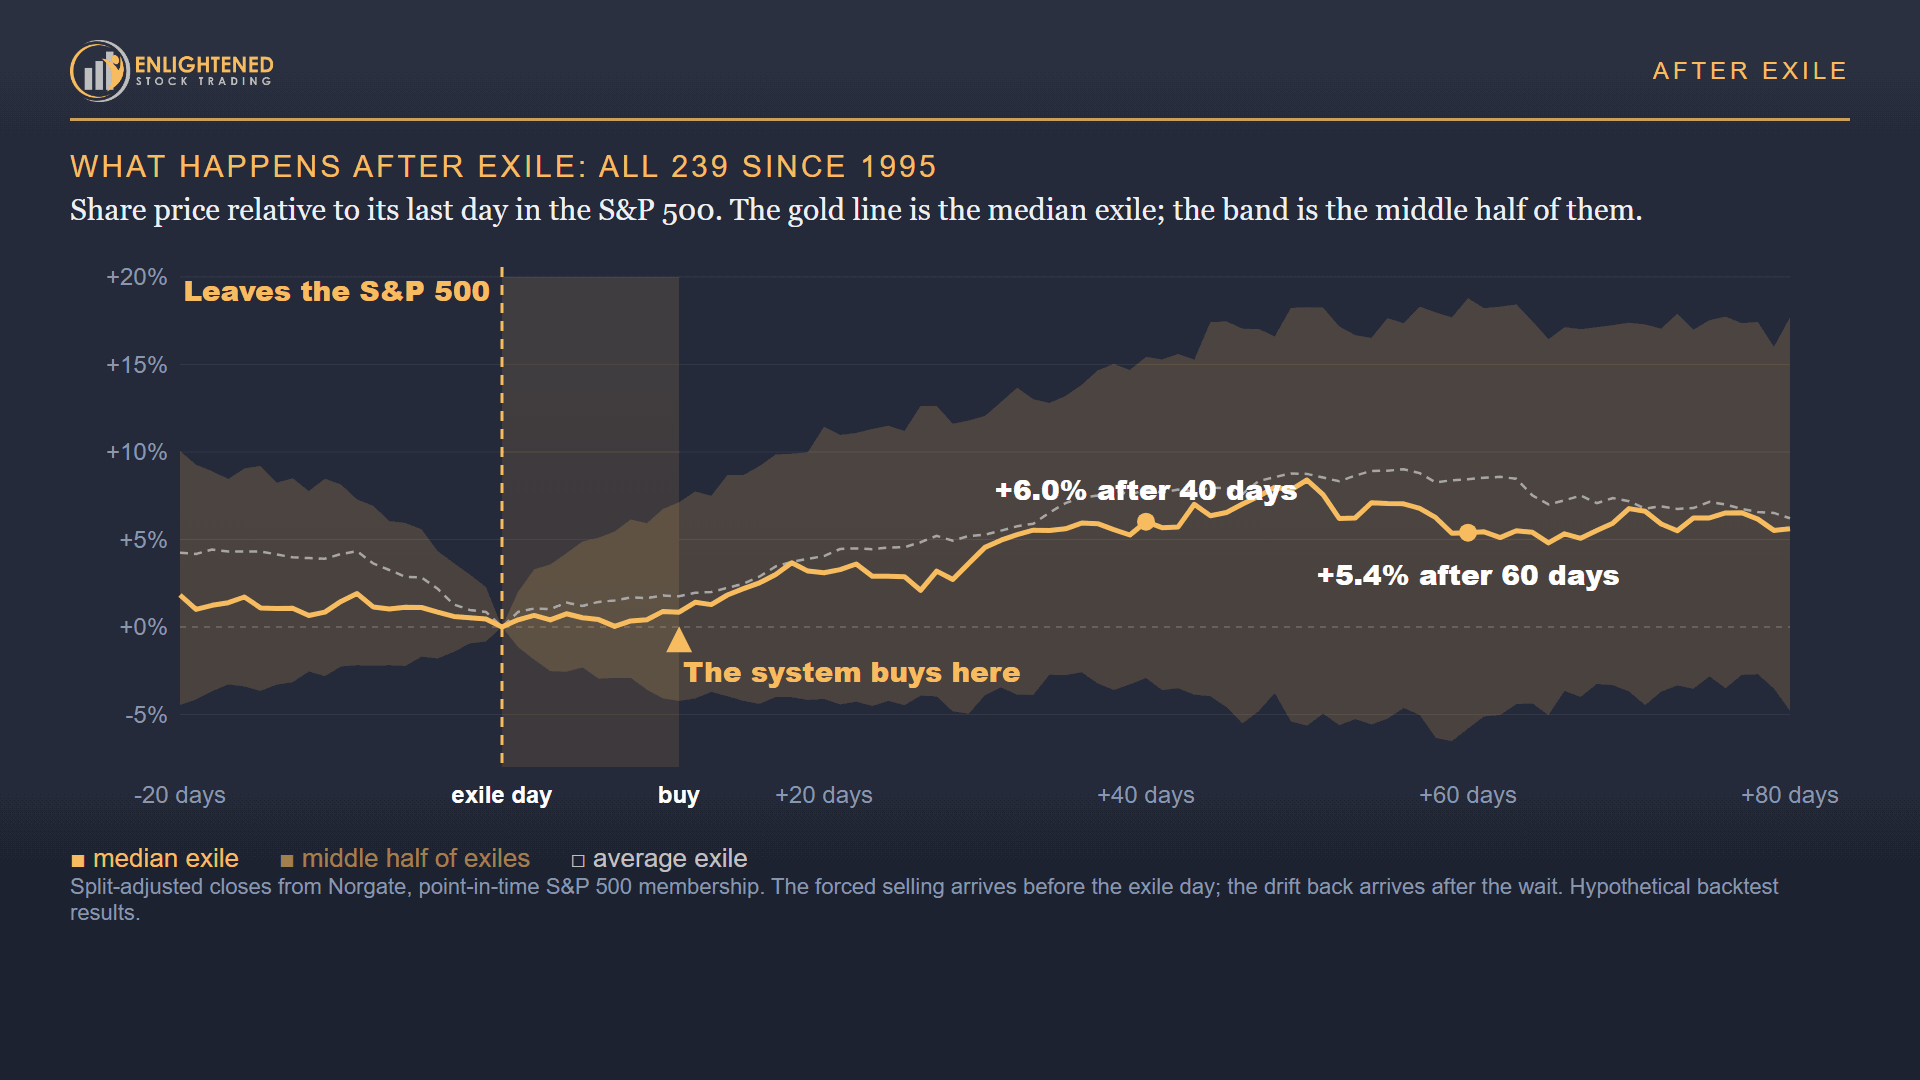
Why haven’t other traders competed this edge away? Two reasons. The selling is written into the funds’ mandates, and it grows as passive ownership grows. And the trade is uncomfortable. Few people want to buy a company in the week it was declared not good enough for the index, with every headline bad, often in the middle of a bear market. The rules buy it anyway, and the exits are placed before you have time to form an opinion.
This is also why you could not trade it consistently by hand. Of the 151 winners, 69 were down more than 5% before they reached the target. Of the 88 losers, 41 were up more than 5% before they hit the stop. A discretionary trader sells the first group in a panic at the worst moment, and the habit of grabbing a quick profit that saves them on the second group is the same habit that cuts every big winner short. The system held both groups to the same exits, because neither exit had been hit.
Did It Hold Up on Data It Had Never Seen?
Yes. On eight and a half years of data it had never seen, it returned 6.8% a year with a worst drawdown of 21%, and one trade in four still ran to the full profit target.
I locked the rules at the end of 2017 and ran the system on January 2018 to October 2026, as a trader who already held it would have experienced it.
| Index Exile Bounce | In sample, 1995 to 2017 | Out of sample, January 2018 to October 2026 |
|---|---|---|
| CAGR | 8.8% | 6.8% |
| Worst drawdown | -20.3% (2014 to 2016) | -21.2% (2021 to 2024) |
| MAR ratio | 0.43 | 0.32 |
| Trades entered | 153 | 86 |
| Ran to the full profit target | 40 of 153, one in four | 21 of 86, one in four |
The MAR ratio is annual return divided by worst drawdown, so higher is better.
Here is what held up. The average winner got bigger, +18.0% against +16.4% in development. The win rate fell from 66% to 58%, so the profit per trade softened, with 2022 and 2023 the weakest stretch. One trade in four still ran to the full target, and no trade in the unseen years lost more than 23%. The last two and a half years are among the strongest in the whole test: 37 trades, 62% winners.
So what this system gives you is a different return stream with a shallower worst drawdown than holding the index. That is the case for holding it alongside the index, not instead of it, and the portfolio section below puts numbers on it.
The S&P 500 fell more than 15% four times in that window. The system made money in all four of those years. In March 2020, in the worst week of the crash, it bought Cimarex Energy, which had just been removed from the index, and the trade hit its target the next day.
One warning. I ran the same rules on ten other stock indexes, large and small, across several countries. It did not work on any of them. The edge needs three things: a committee that deletes companies by decision, trillions of passive dollars forced to sell within days, and large companies that survive the demotion. Only the S&P 500 has all three, so do not run this system on any other index.
How Does It Compare With the S&P 500 Over Thirty-Two Years?
The index made more, 9.3% a year against 8.2%, with a worst drawdown more than two and a half times as deep.
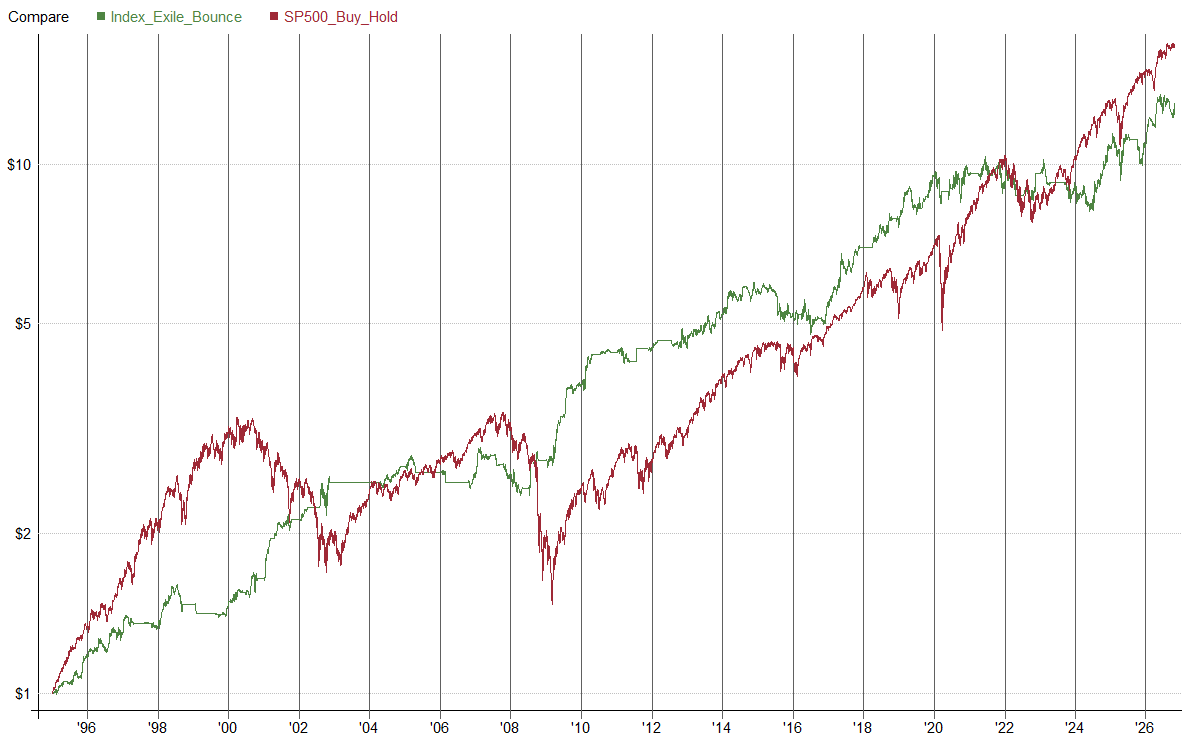
Now look at the index’s worst years.
| Year | S&P 500 | System |
|---|---|---|
| 2000 | -10.1% | +10.7% |
| 2001 | -13.0% | +29.0% |
| 2002 | -23.3% | +17.7% |
| 2008 | -38.4% | +6.0% |
| 2011 | -0.0% | +0.9% |
| 2015 | -0.7% | -10.1% |
| 2018 | -6.2% | +12.0% |
| 2022 | -19.4% | +4.0% |
Every calendar year the S&P 500 finished lower, 1995 to 2025. The five bear years are 2000, 2001, 2002, 2008 and 2022. Hypothetical backtest results.
In all five of the index’s bear years, the system made money and beat the index. Bear markets produce more deletions, heavier forced selling and deeper price overshoots, and those are its best trades. From 2000 to 2002 it gained 40% while the index lost 49%. In 2009 it made 38.5%, its best year, buying what the index funds had just dumped. Of the eight years the index finished lower, the system made money in seven. The exception was 2015, a flat year for the index, when a poor run of trades cost it 10%.
| Full period, 3 January 1995 to 28 October 2026 | Index Exile Bounce | S&P 500 |
|---|---|---|
| CAGR | 8.24% | 9.28% |
| Worst drawdown | -21.24% | -56.72% |
| MAR ratio | 0.39 | 0.16 |
| Return per unit of time in market (CAGR / time in market) | 28.0% | 9.3% |
| Time in market | 29.4% | 100% |
| Trades | 239 | |
| Win rate | 63.2% | |
| Profit factor | 1.71 | |
| Median hold | 58 trading days |
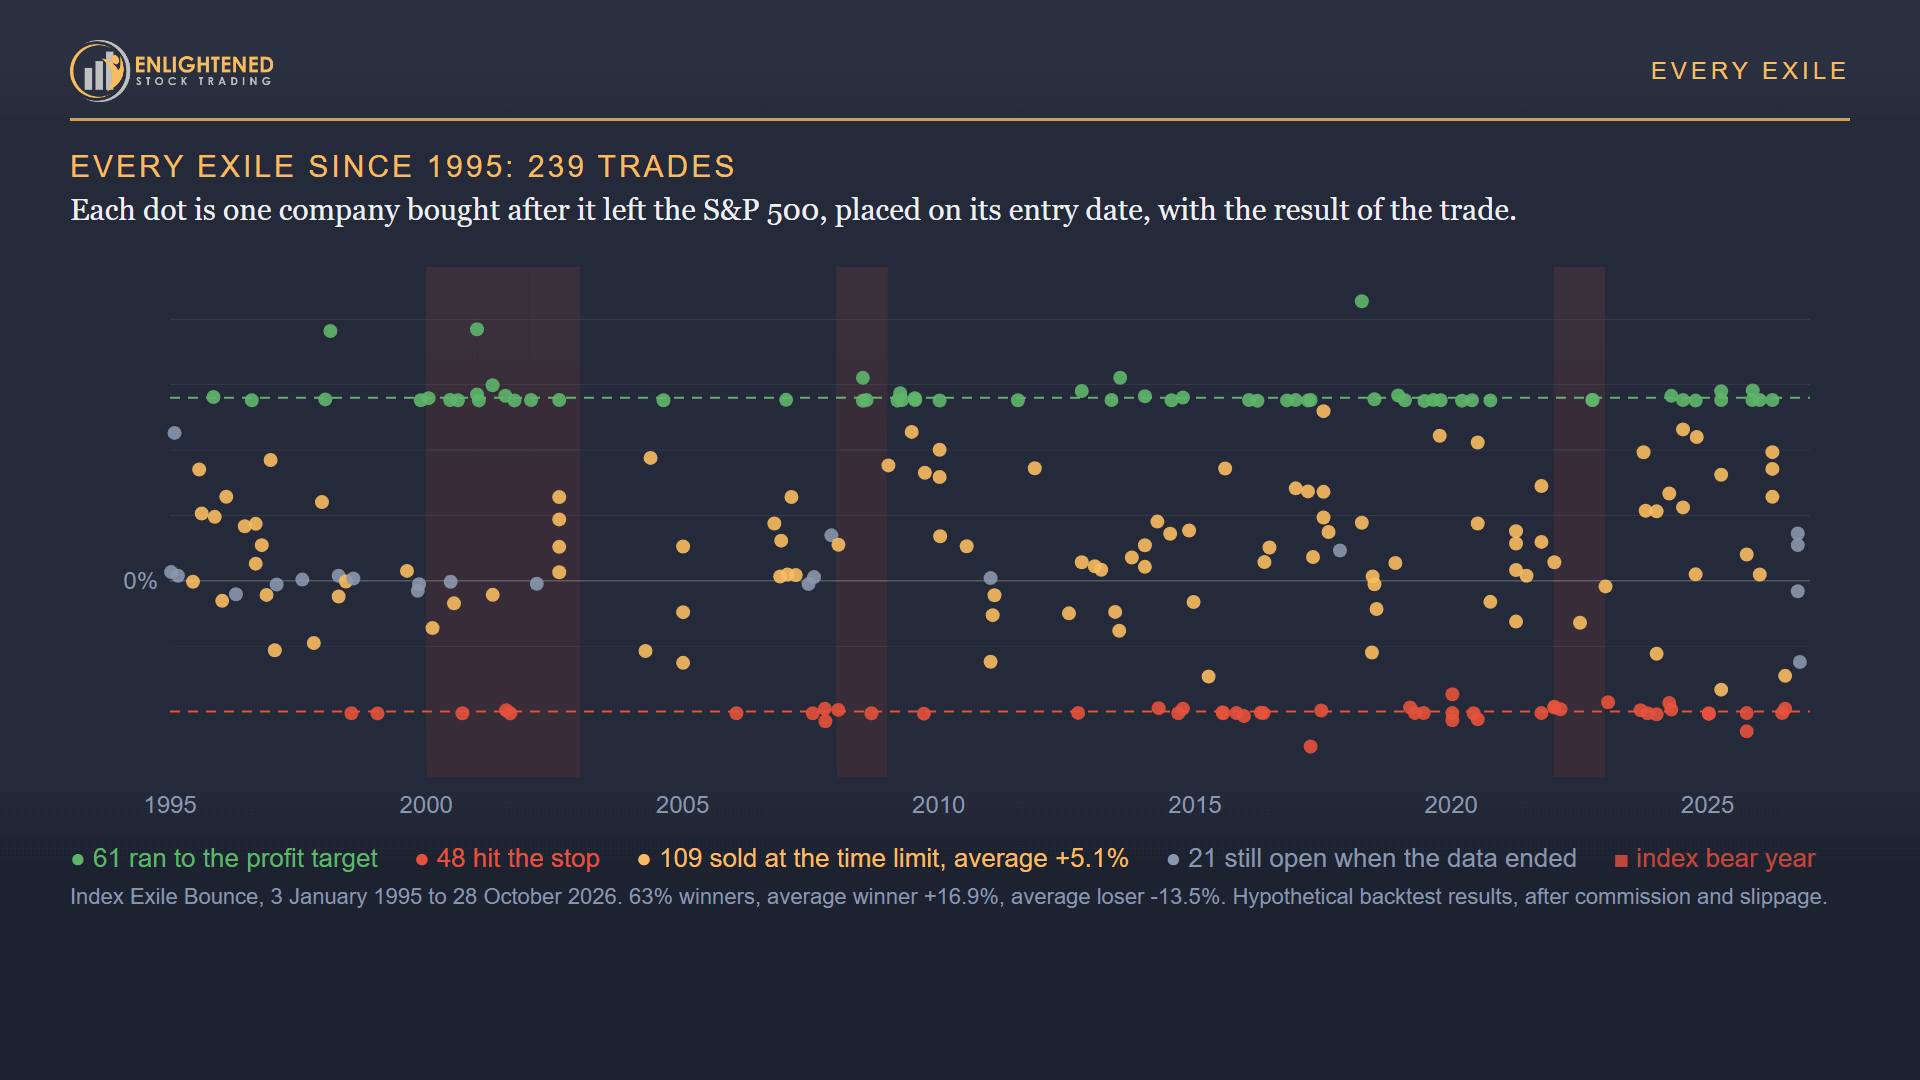
The green dots sit on the target line and the red dots on the stop line, because the exits are fixed numbers. The trades are as frequent in the index-fund era as before it, so the growth of passive investing has not competed the edge away.
What Does Adding It Do to the Portfolio You Already Have?
In this test, moving 20% of a portfolio into it lowered the worst drawdown of every index portfolio below, and improved risk-adjusted return in 12 of 15 portfolios.
If you own an index fund, your fund is the forced seller. Every time the committee changes the list, your fund sells the exile at whatever price it can get. This system is on the other side of that trade.
I took fifteen benchmark portfolios, four index buy-and-holds and eleven established trading systems across the US, Australia, Canada and Hong Kong, and moved 20% of each into the Index Exile Bounce, rebalanced monthly. The risk-adjusted return improved in twelve, was unchanged in one, and fell slightly in two.
| If you hold… | CAGR alone | With a 20% slice | Worst drawdown alone | With a 20% slice |
|---|---|---|---|---|
| S&P 500 | 11.1% | 10.8% | -55% | -47% |
| Nasdaq 100 | 14.4% | 13.7% | -83% | -73% |
| ASX 200 | 5.2% | 6.0% | -54% | -45% |
| S&P/TSX | 6.9% | 7.5% | -49% | -40% |
The S&P 500 shows 11.1% here because this test holds the SPY index fund with dividends reinvested, as an index investor would. The 9.28% in the full-period table is the S&P 500 price index without dividends.
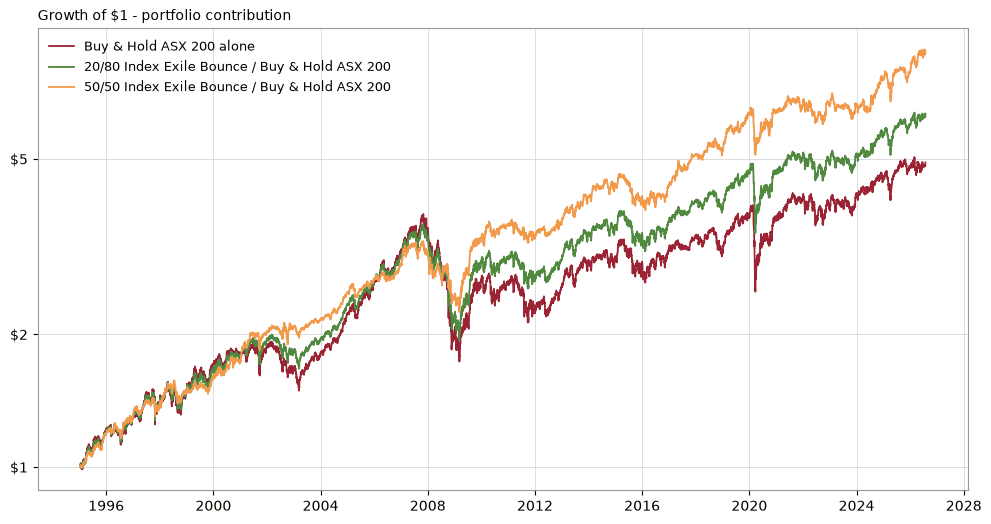
A US index investor gives up a third of a percentage point of return a year and cuts the worst drawdown by eight points. An Australian or Canadian index investor gains return and cuts the worst drawdown by nine points. The ASX 200 alone turned $1 into about $5 over those years, with a 54% worst drawdown. With a fifth of the capital in this system it reached about $6.30 with a 45% worst drawdown, and half and half reached about $8.70 with 31%.
The two barely move together. The system’s correlation to the ASX 200 is 0.08, and to the S&P 500 it is 0.34 (1.0 means two things move in lockstep, 0 means no relationship at all). Its trades happen in New York, for reasons unrelated to the market you hold, which makes it close to uncorrelated with an Australian portfolio.
What Is It Actually Like to Trade It?
A few minutes after the close, and on most evenings nothing at all. Here is an ordinary one. You update the data and run the scan. It takes two to five minutes, end of day, and most days it says there is nothing to do. You close the computer and get on with your evening.
Seven or eight evenings a year it says buy. You place the order for the next open, and with it the three exits: the target, the stop and the date. That is the last decision you make on that trade. The median position lasts 58 trading days and none outlives its time limit, so no losing position stays open indefinitely.
The Evening the Old Fear Does Not Fire
One of your positions is down 18% and the headlines are worse than when you bought. This is the night you used to decide whether to hold, add, or sell.
Trading this system, you do nothing, because the stop order has been with the broker since the day you bought. If the stock hits it tomorrow, you are out at the level you chose, and you knew going in that one trade in five ends this way. If it does not, you hold. Sixty-nine of the system’s winners were down more than 5% before they reached the target.
When the Index Booms and This System Does Not
The other evening that used to hurt is the bull year. In 2023 the index made 24% and this system lost nearly 7%. The committee removed almost nobody, which was great news for the S&P 500 and very boring for this system, and the few trades went nowhere.
You knew that going in, too. The system lagged the index in 16 of the 19 full years the index rose more than 10%, and on an average day 70% of its capital is in cash. That capital is working in your other systems, and this one is waiting for the years they struggle.
What You Stop Doing
You stop asking whether this is the right dip, because the removal answers that. You stop picking stocks from tips and conversations, because a committee in New York picks them by throwing them out. You stop trying to time the market, because every market filter I tested made this system worse. And you stop watching positions all day, because the orders are with the broker.
This is what rules-based trading looks like in practice. The decisions are made once, in advance, and you carry them out calmly and consistently. You still trade individual companies, and you still know exactly why you are in each one. The reason is a rule on one page, plain enough that someone else could run it for you.
In 2006 I handed my wife Stephanie a written trading plan and went trekking in Nepal for a month while my systems kept running. This system is simpler than those were.
| Trading the Index Exile Bounce | |
|---|---|
| Time in market | 29% of the account invested on an average day; fully in cash three days in ten |
| Trades | About seven a year; 239 in thirty-two years |
| Rules | Seven: four to buy, three to sell, plus the portfolio rules on sizing, ranking and the position cap |
| Hold | Median 58 trading days, never past the time limit |
| Correlation to the S&P 500 | 0.34 |
| Why it keeps working | Index funds must sell what the committee deletes, and almost nobody wants to buy a company in the week it was thrown out |
| What it costs | Most of the money waiting in cash, and a lag behind the index in most strong years |
How Can You Get the Rules and Code?
They are free. The exact rules, every value, and the RealTest code are yours here: Get the Index Exile Bounce rules and code. The Index Exile Bounce went into incubation in July 2026: traded on paper and reported every month before a dollar of my own goes near it. The code needs RealTest and a Norgate Data subscription that includes the S&P 500 historical constituents. A test built on today’s index list only includes the companies that survived, so it will overstate the results. That is survivorship bias, and it is the most common way this idea gets tested wrongly.
Get the Index Exile Bounce Rules + Code (Free)
A free system is a hypothesis until you have tested it yourself. Before you trade it:
- Make sure you can explain every rule in plain English.
- Backtest it yourself with realistic costs, and spot check a large number of trades to confirm the code enters and exits on the right day at the right price.
- Trade it at small size first, and watch your own psychology through the stops and through the quiet stretches. The system once went 615 days without a trade.
- Run it on the S&P 500 only. I tried ten other indexes, and it failed on every one.
The lesson for your own trading: “buy the dip” fails because nothing about it is written down. A dip with a known seller gives you something to write down: who is selling, why they have to, when you buy, how much, and when you get out. Write those rules before the dip arrives. When it comes, you place the orders you already decided on, and if it keeps falling, the stop takes you out at a level you chose in advance.
If you want to build and test your own rules-based systems like this one, from finding the edge to stress-testing it and trading it with confidence, that is what The Trader Success System teaches.
Remember – You are only one trading system away!
Adrian Reid
Founder – Enlightened Stock Trading
Frequently Asked Questions
Does buying stocks removed from the S&P 500 work as a trading strategy?
In this test, yes, when it follows fixed rules. Buying a company a set number of days after its removal from the S&P 500, once it passes a price and liquidity check, and selling at a fixed profit target, a fixed stop or a time limit, returned 8.2% a year from 1995 to 2026 with a worst drawdown of 21%. The index returned 9.3% a year with a worst drawdown of 57%. The system made money in all five of the index’s bear years.
How did the Index Exile Bounce perform out of sample?
From January 2018 to October 2026, traded continuously as a real account would have been, it returned 6.8% a year with a worst drawdown of 21%. The index returned more over that period, on both return and risk-adjusted return. The average winning trade grew, one trade in four still ran to the full target, and the last two and a half years were among the strongest in the whole test.
What does adding it do to an existing portfolio?
Moving 20% of a portfolio into it improved the risk-adjusted return of 12 of 15 benchmark portfolios. For an S&P 500 investor it cut the worst drawdown from 55% to 47%, at a cost of a third of a percentage point of return a year. For an ASX 200 investor it raised the return and cut the worst drawdown by nine points.
Are the rules for the Index Exile Bounce available?
Yes. This article explains how the system works. The exact rules, every parameter value and the RealTest code are free through the opt-in link above.
Disclaimer
This article is general information and education only. It is not personal financial advice and does not take into account your objectives, financial situation or needs. It is published by AMS Trading & Investments Pty Ltd t/a Enlightened Stock Trading and is subject to the terms and conditions at enlightenedstocktrading.com/about/legal-terms-and-conditions.
All results shown are hypothetical backtest results. Hypothetical or simulated performance results have certain limitations. Unlike an actual performance record, simulated results do not represent actual trading. Since the trades have not been executed, the results may have under or over compensated for the impact of certain market factors, such as lack of liquidity. Simulated trading programs are also designed with the benefit of hindsight. No representation is being made that any account will or is likely to achieve profits or losses similar to those shown. Past performance is not indicative of future results. Trading involves risk of loss. Before acting on any backtest result, spot check a large number of trades yourself to confirm the code enters and exits on the correct day at the correct price.