Two trading systems each make 20% in a year. Their monthly returns bounce around by almost exactly the same amount, so their Sharpe ratios are nearly identical: 1.21 and 1.20.
One of them loses a little in half the months and makes its money in two big winners. The other makes a steady 3% to 4% most months and then gives back 10% in a single month and 7% in another.
Would you say those two systems carry the same risk? The Sharpe ratio does. The Sortino ratio scores the first one at 3.89 and the second at 1.64.
That gap is the reason the Sortino ratio exists, and it is why I find it more useful than the Sharpe ratio for judging a rules-based trading system. It is also a number that is easy to calculate wrongly, easy to inflate, and blind to the one risk that makes traders abandon good systems. This article covers the formula, a full worked example you can check by hand, what a good Sortino ratio looks like, and the four ways it can mislead you when you read it off a backtest report.
What Is The Sortino Ratio?
The Sortino ratio is a risk-adjusted return measure that divides a strategy’s return above a target by its downside deviation. It only counts returns that fall below the target as risk, so large winning periods do not reduce the score.
It is a modification of the Sharpe ratio. The Sharpe ratio divides return by total volatility, which means a month where you make 12% increases your measured “risk” exactly as much as a month where you lose 12%. The Sortino ratio keeps the same numerator and swaps the denominator for a measure built from the bad periods only.
The ratio is named after Frank Sortino, a finance professor who spent much of his career arguing that investors care about falling short of a goal and do not care about exceeding it. The calculation itself was popularised in the early 1980s by Brian Rom, who built it into performance software and named it after Sortino.
For a systematic trader the idea matches common sense. As I tell my students, the only volatility that is bad is the volatility you do not want. If your equity curve is jumping around because it is hammering upward on a strong trend, the system is doing what it was built to do.
What Is The Sortino Ratio Formula?
The Sortino ratio formula is:
Sortino Ratio = (R – T) / DD
Where:
- R = the average return of the portfolio or trading system over the period
- T = the target return, also called the minimum acceptable return. Most people use the risk-free rate or zero
- DD = the downside deviation, which measures how far returns fell below the target
Like the Sharpe ratio, the result is almost always annualised. If you calculate it from monthly returns, multiply by the square root of 12. From daily returns, multiply by the square root of 252.
The numerator is easy. All of the difficulty, and most of the mistakes, are in the denominator.
What Is Downside Deviation?
Downside deviation is the square root of the average squared shortfall below the target return. It is calculated like standard deviation, except that any period at or above the target counts as zero, and shortfalls are measured from the target instead of from the average.
To calculate it:
- For each period, subtract the target from the return.
- If the result is positive, replace it with zero. If it is negative, keep it.
- Square each value.
- Add the squares together and divide by the total number of periods, including the ones you set to zero.
- Take the square root.
Step 4 is where people go wrong, and it is covered in detail below. You will also see downside deviation called semi-deviation or target semi-deviation. Strictly, semi-deviation measures shortfalls below the average return and downside deviation measures shortfalls below a target you choose, but many sources use the terms interchangeably.
How Do You Calculate The Sortino Ratio? A Worked Example
Here are twelve monthly returns for the first system from the introduction. It behaves like a typical trend following system: several small losing months and a few large winning ones. The target return is 0% to keep the arithmetic simple. These are illustrative numbers chosen to show the calculation, not backtest results.
| Month | Return | Shortfall below 0% | Shortfall squared |
|---|---|---|---|
| 1 | -2.0% | -2.0 | 4.00 |
| 2 | -1.5% | -1.5 | 2.25 |
| 3 | +3.0% | 0 | 0 |
| 4 | -2.5% | -2.5 | 6.25 |
| 5 | +9.0% | 0 | 0 |
| 6 | -1.0% | -1.0 | 1.00 |
| 7 | +1.5% | 0 | 0 |
| 8 | -3.0% | -3.0 | 9.00 |
| 9 | +12.0% | 0 | 0 |
| 10 | -2.0% | -2.0 | 4.00 |
| 11 | +2.5% | 0 | 0 |
| 12 | +4.0% | 0 | 0 |
| Total | +20.0% | 26.50 |
Step 1 – average return. 20% divided by 12 months is 1.67% per month.
Step 2 – downside deviation. 26.50 divided by 12 periods is 2.21. The square root of 2.21 is 1.49%.
Step 3 – monthly Sortino ratio. (1.67% – 0%) divided by 1.49% is 1.12.
Step 4 – annualise. 1.12 multiplied by the square root of 12 (3.46) gives a Sortino ratio of 3.89.
For comparison, the ordinary standard deviation of those twelve returns is 4.78%, which gives a Sharpe ratio of 1.21. The two winning months of 9% and 12% make up most of that 4.78%. The Sharpe ratio treats them as risk. The Sortino ratio ignores them.
Sortino Ratio Vs Sharpe Ratio: What Is The Difference?
The Sharpe ratio divides return by total volatility, so it penalises large gains and large losses equally. The Sortino ratio divides return by downside deviation, so it penalises only the returns that fall below your target. When returns are lopsided, the two numbers tell very different stories.
Go back to the two systems from the introduction. System A is the one in the worked example. System B makes between 3% and 4.5% in ten of the twelve months, loses 10% in month 5 and loses 7% in month 10.
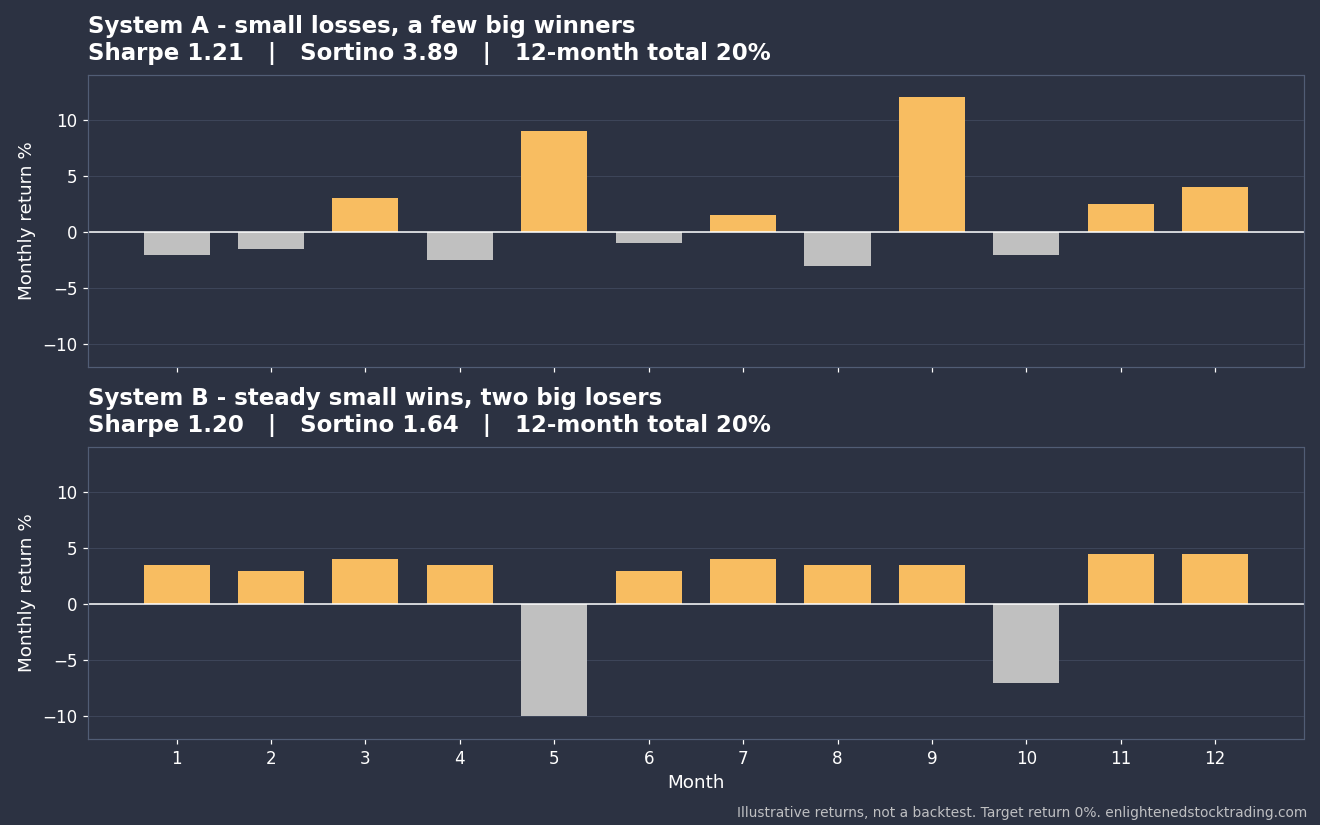
| System A | System B | |
|---|---|---|
| Return profile | Small losses, a few big winners | Steady small wins, two big losers |
| 12-month total | 20% | 20% |
| Standard deviation (monthly) | 4.78% | 4.82% |
| Sharpe ratio | 1.21 | 1.20 |
| Downside deviation (monthly) | 1.49% | 3.52% |
| Sortino ratio | 3.89 | 1.64 |
| Worst month | -3% | -10% |
On the Sharpe ratio these systems are a coin toss. On the Sortino ratio System A is more than twice as good, because its volatility comes from its winners and System B’s volatility comes from its losers.
This matters a great deal for anyone who trades trend following. The whole edge is asymmetric: many small losses, paid for by occasional large gains. A metric that punishes those gains will steer you away from the systems that are working as designed. It matters in the other direction too. Strategies that collect small, regular profits and occasionally take a large hit, such as selling options or some aggressive mean reversion approaches, tend to look better on the Sharpe ratio than they deserve.
A quick check: compare the two ratios
Here is a practical use for the pair of numbers that most articles skip. If a system’s returns were perfectly symmetric, its Sortino ratio would come out at roughly 1.4 times its Sharpe ratio, or a little more.
- Sortino well above 1.4 times Sharpe – the volatility is mostly on the upside. System A’s Sortino is 3.2 times its Sharpe.
- Sortino close to or below 1.4 times Sharpe – the losses are as large as the gains, or larger. System B’s Sortino is 1.37 times its Sharpe, which is your cue to go and look at its worst months before you trust the headline return.
You do not need the exact multiple. You just need to notice when a system with an attractive Sharpe ratio has a Sortino ratio that barely beats it.
What Is A Good Sortino Ratio?
By the convention most brokers and data providers publish, a Sortino ratio above 1.0 is good, above 2.0 is very good and above 3.0 is excellent.
| Sortino Ratio | Common interpretation |
|---|---|
| Below 1.0 | Sub-optimal |
| 1.0 to 2.0 | Good |
| 2.0 to 3.0 | Very good |
| Above 3.0 | Excellent |
Treat that scale with care, for two reasons.
First, the Sortino ratio of a strategy is usually higher than its Sharpe ratio, so a Sortino of 1.5 is not better than a Sharpe of 1.2. They are on different scales. A single end-of-day stock system with a realistic Sharpe ratio of around 0.7 to 1.3 will typically show a Sortino ratio somewhere between 1 and 2, and that is a perfectly tradeable result.
Second, a very high Sortino ratio on a backtest should make you suspicious before it makes you excited. System A scores 3.89 over twelve months, and twelve months is nowhere near enough data to believe it. A Sortino ratio above 3 on a single system across a long backtest usually means too few trades, a test period that missed a bear market, or rules that have been fitted to the past.
Only compare Sortino ratios that were calculated the same way: same target return, same return frequency, same test period. The next section explains why.
What Are The Limitations Of The Sortino Ratio?
The Sortino ratio fixes the biggest flaw in the Sharpe ratio, and it still has four limitations that can lead a trader to trust a fragile system.
1. The number changes with how it is calculated
There is no single agreed calculation, and three choices move the result.
The target return. Zero, the risk-free rate and a personal minimum such as 10% a year all give different answers for the same system. A higher target turns more periods into shortfalls and lowers the ratio.
The return frequency. Daily, weekly and monthly returns produce different Sortino ratios for the same equity curve.
The divisor. This is the common error. The correct downside deviation divides the squared shortfalls by the total number of periods. Many spreadsheets and some software instead take the standard deviation of the losing periods on their own. For System A that shortcut gives a downside deviation of 0.71% instead of 1.49%, and a Sortino ratio of 8.17 instead of 3.89. The six losing months were all between -1% and -3%, so they are close to each other, and the shortcut reads that tight cluster as low risk. It measures how consistent your losses are and ignores how large or how frequent they are.
Before you compare a Sortino ratio from your backtesting software with one from a fund fact sheet or another trader’s spreadsheet, find out which target, which frequency and which divisor each one used. Some backtesting packages do not report the Sortino ratio at all, and those that do are not consistent with each other.
2. It needs losses to measure, and some systems have not had theirs yet
Downside deviation is built only from the periods that fell short. If there are few of them, the estimate rests on very little data and one more bad month can change it dramatically.
Look at System B after its first four months: 3.5%, 3%, 4% and 3.5%. There are no losing months, the downside deviation is zero and the Sortino ratio is infinite. One month later it has lost 10%. A strategy that has not yet shown its worst loss can post an outstanding Sortino ratio right up to the day the loss arrives. That is the profile of many of the funds in the hedge fund graveyard: years of smooth returns, then one event that the track record gave no warning of.
A high Sortino ratio from a short test, or from a test with a handful of losing periods, tells you very little.
3. It cannot see drawdown
This is the limitation that matters most in live trading. The Sortino ratio treats every losing period as a separate event. It does not know whether your losses were spread out or arrived back to back.
Take System A’s twelve monthly returns and reorder them so the six winning months come first and the six losing months follow one after another. The average return is unchanged. The downside deviation is unchanged. The Sortino ratio is still 3.89. But the maximum drawdown goes from 3.5% to 11.4%, more than three times as deep, and it lasts six months instead of two.
Those are two very different experiences for the person trading the system, and the Sortino ratio rates them as identical. Traders do not quit systems because of one bad month. They quit after a run of bad months has eroded enough capital and enough confidence that they stop taking the signals, usually just before the system recovers. No ratio built from individual period returns can measure that. You have to look at the drawdown directly.
4. It is one number, so it can be curve-fitted
If you ask your backtesting software to find the parameters with the highest Sortino ratio, it will find them. It will also tend to find the combination that happened to dodge the two or three worst months in the test period, because removing a few large shortfalls is the fastest way to shrink the denominator. Those parameters are fitted to specific historical events and will not repeat.
The defence is the same as for any metric. Look for a broad range of parameter values that all perform acceptably instead of one isolated peak, insist on enough trades across different market conditions, and check the results on data the system has not seen. The guide to trading system optimization covers how to do this without fitting to noise.
How Should A Systematic Trader Use The Sortino Ratio?
Use the Sortino ratio as a fairer replacement for the Sharpe ratio when comparing systems, and never as the number that decides whether a system gets traded. It answers one question well: is this system’s volatility coming from its winners or its losers?
Here is how it fits with the other measures I look at when evaluating a system.
| Metric | Question it answers | What it misses |
|---|---|---|
| Sharpe ratio | How much return per unit of total volatility? | Penalises big winners; ignores drawdown |
| Sortino ratio | How much return per unit of harmful volatility? | Sequence of losses; depth and length of drawdown |
| CAGR | How fast did the account compound? | Everything about risk |
| MAR ratio (CAGR / maximum drawdown) | How much return for the worst pain you had to sit through? | How long the drawdown lasted |
| Maximum drawdown and its duration | Could I have survived this, financially and psychologically? | Whether the next one will be worse |
My preferred single measure of system quality is the MAR ratio, because it compares the return directly with the worst peak-to-trough loss. I want an equity curve like a ruler heading up, and the MAR ratio rewards that more honestly than any volatility-based ratio. As a guide, I treat 0.5 as the minimum for considering a system and 0.8 or better as the target.
In practice the order I work through is:
- Check the trade-level statistics first. Percent winners, average win, average loss and expectancy tell you whether there is a real edge. You can test your own numbers with the trading expectancy calculator.
- Look at maximum drawdown and how long it lasted. Ask whether you would have kept trading through it with real money. Then assume the next one will be worse, because your maximum drawdown is always ahead of you.
- Use the MAR ratio to compare return with that drawdown.
- Use the Sortino ratio, alongside the Sharpe ratio, as a cross-check on where the volatility is coming from.
- Judge the system by what it adds to your portfolio. A system with an average Sortino ratio can still be the best addition to a portfolio of trading systems if it makes money when your other systems are losing.
Frequently Asked Questions About The Sortino Ratio
What does the Sortino ratio tell you?
It tells you how much return a strategy earned above a target for each unit of downside risk. A higher Sortino ratio means more return for the same amount of below-target volatility. Unlike the Sharpe ratio, it does not count large gains as risk.
Is a higher Sortino ratio always better?
No. A high Sortino ratio is only meaningful if it comes from a long test with plenty of losing periods and a sensible drawdown. A short backtest, or a strategy that has not yet had its large loss, can show a very high Sortino ratio that will not last.
Is the Sortino ratio better than the Sharpe ratio?
For trading systems with lopsided returns, yes. Trend following systems make their money from a few large winners, and the Sharpe ratio penalises those winners while the Sortino ratio does not. For strategies with roughly symmetric returns the two ratios rank systems in much the same order.
What is a negative Sortino ratio?
A negative Sortino ratio means the strategy’s average return was below the target return over the period. As with a negative Sharpe ratio, the size of the negative number is not informative. The only useful reading is that the system did not earn its target.
What target return should I use for the Sortino ratio?
The risk-free rate and zero are the two most common choices. Zero is the simplest for a private trader, because it defines risk as losing money. What matters most is using the same target every time, so your systems are compared on the same basis.
What is the difference between the Sortino ratio and the Calmar or MAR ratio?
The Sortino ratio measures return against the size of all below-target periods. The Calmar and MAR ratios measure compound annual return against the single worst peak-to-trough drawdown. The Sortino ratio cannot see a run of consecutive losses. The MAR ratio is built from it.
Measure Your Systems The Way You Will Experience Them
The Sortino ratio is a better question than the Sharpe ratio, because it stops treating your best months as a problem. Calculate it properly, with the total number of periods in the divisor and the same target every time, and compare it with the Sharpe ratio to see where a system’s volatility comes from. Then go and look at the drawdown, because that is what you will have to sit through with real money.
Knowing which numbers to trust on a backtest report is a large part of what separates consistent, rules-based traders from erratic ones. If you are the kind of analytical person who wants to build proven, backtested systems and evaluate them properly, that is what we teach inside the Trader Success System. It is a structured path to building a diversified portfolio of systems you understand well enough to keep trading through the drawdowns.
Remember – You are only one trading system away!