The buy the dip strategy is the oldest advice in the market. So I built it into a proper rules-based system and tested it on every S&P 500 stock since 1990 – including the ones that later went bust. Here is what the data actually said about buying the dip.
Every trader has heard it. Stock gets hit, you step in, you buy the dip. It sounds obvious, and obvious is exactly what makes me suspicious. Plenty of things that feel true in the market cost you money in practice.
So I did what I do with every idea before it goes anywhere near real capital. I turned the buy the dip strategy into a precise, rules-based system with defined entries, exits, and position sizing, and I ran it across more than three decades of data. No opinions. No chart-reading. Just the numbers.
This is the story of that test – the good, the ugly, and the verdict at the end. I am not going to hand you the exact rules and settings, because this system is still in incubation and there is a live edge to protect. What I will give you is the complete performance picture, the tools it is built from, and the reasoning, so you can judge it for yourself.
Here is where it finished after 36 years.
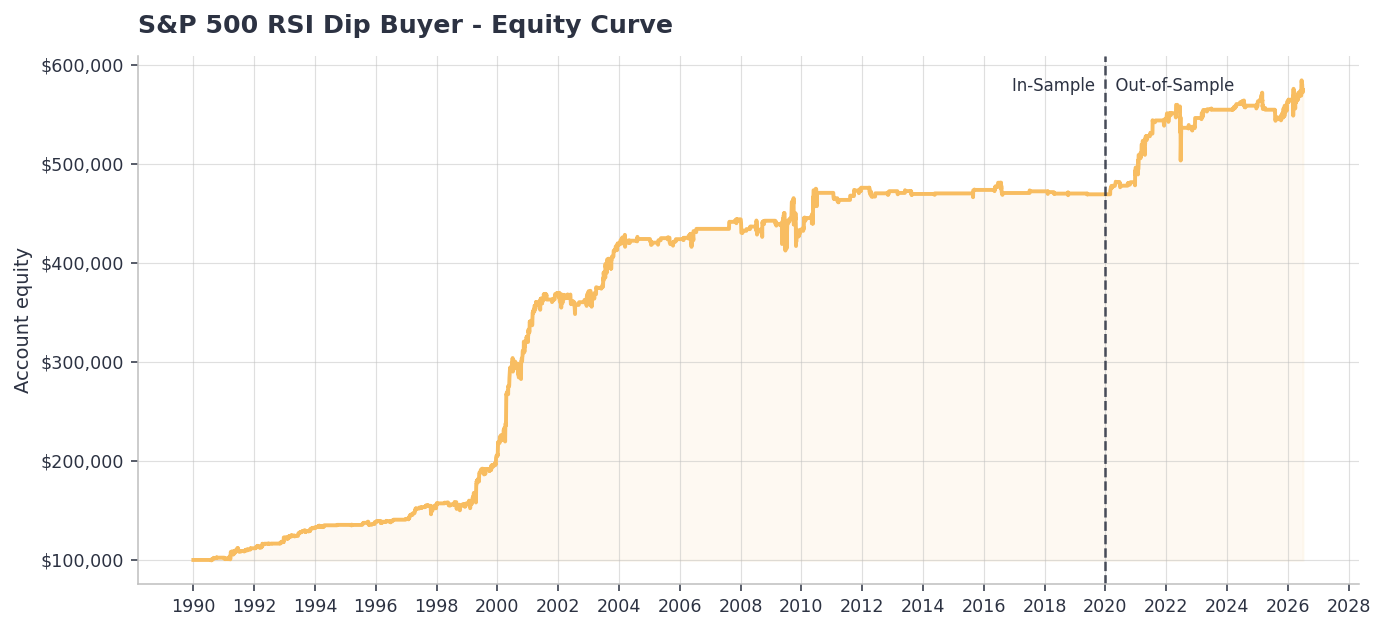
That is $100,000 growing to more than $574,000. But that smooth-looking climb hides a much more interesting story, and the story is the point.
What is the buy the dip strategy?
At its core, the buy the dip strategy is a mean reversion strategy. It trades individual stocks that are, or once were, members of the S&P 500, and it only goes long. In plain terms, it looks for a strong, established company whose share price has just been slammed down to a short-term extreme, and it steps in to buy the fear – then exits a few days later when the price recovers.
That is the whole shape of it. Buy the panic in a quality name, hold briefly, sell the bounce. It spends most of its life in cash, waiting for those moments of dislocation to appear.
Under the hood, it leans on a few well-known tools rather than anything exotic. A short-term momentum oscillator – think RSI – measures how sharply oversold a stock has become. A long-term moving average keeps it anchored to the trend, so it only buys dips in stocks that are still fundamentally climbing rather than trying to catch a company on its way to zero. And a volatility measure, ATR, does double duty: it screens for names that actually move enough to be worth trading, and it sets the protective stop. I am not going to give you the exact settings – the specific lengths, the trigger levels, and the way they combine are what stays behind the members’ wall – but that is the shape of the machine.
If you want the broader picture of how counter-trend systems like this work, I have written a full guide to mean reversion trading. For now, the important thing is the logic.
Why should a buy the dip strategy have an edge?
An edge you cannot explain is an edge you cannot trust. So before testing, I wanted a structural reason a buy the dip strategy should work at all.
When a solid company gets sold off hard in a couple of days, the seller is usually not thinking clearly. It is forced selling, margin calls, fund redemptions, or plain fear. That kind of selling overshoots. It pushes the price below where the business is actually valued, and when the panic burns out, the price tends to snap back.
There is a second, sharper reason. This system trades the individual constituents, not the index itself. That distinction matters more than almost anything else here. An index is a blend of hundreds of names, and that blending smooths away the very panic the strategy feeds on. A single stock can fall apart on its own on a Tuesday while the market barely moves. That single-name overshoot is the raw material of the edge, and it is why buying the dip on individual stocks behaves so differently from buying the dip on the index.
That was the hypothesis. Fear in a single strong stock overshoots, and a disciplined buyer gets paid to absorb it.
What would make me reject it?
I go into every test looking for the reasons to say no. For this one, the system would fail if the edge only showed up in a single era and then died, if the average trade was too thin to survive real-world costs, or if it fell apart the moment it met data it had never seen.
Those were the three things I was looking for to reject the system. Let’s see what the results showed us.
What did the raw buy the dip strategy look like before any work?
Here is where I have to be straight with you. The first, untouched version of this system looked mediocre. It compounded at just 1.04% a year.
Most people would have deleted the file right there. But a low return is not the same as no edge, and the two get confused constantly. When I looked underneath the headline number, the per-trade edge was clearly real – the average trade made money, the win rate was healthy, and it behaved exactly like a dip buyer should. The problem was not the edge. The problem was that the system was barely deployed. It sat in cash almost all the time and only ever committed a tiny fraction of the account.
In other words, it had a good engine bolted into a car without enough fuel to leave the driveway. The work was not to invent an edge. It was to take the real one already there and put it to work properly. We optimised the system and put every rule and parameter through significance and robustness testing to make sure what we kept was genuine and not a fluke of the data.
That process is the core of how we build every system, and it is exactly what I teach inside the Trader Success System. The details of how it is done stay in the classroom. The outcome is what follows.
What did the trade data reveal?
Two things stood out that are worth your attention as a system builder.
The first is that this buy the dip strategy is a specialist, not an all-rounder. Look back at that equity curve. The big gains cluster around 2000, 2008, and 2020 – the moments of real market stress and volatility. In the calm, grinding bull years, the line goes nearly flat. The system is not broken in those stretches. It is simply waiting, because its setups only appear when fear is in the market.
You can see exactly how rarely it commits capital in the exposure chart below.
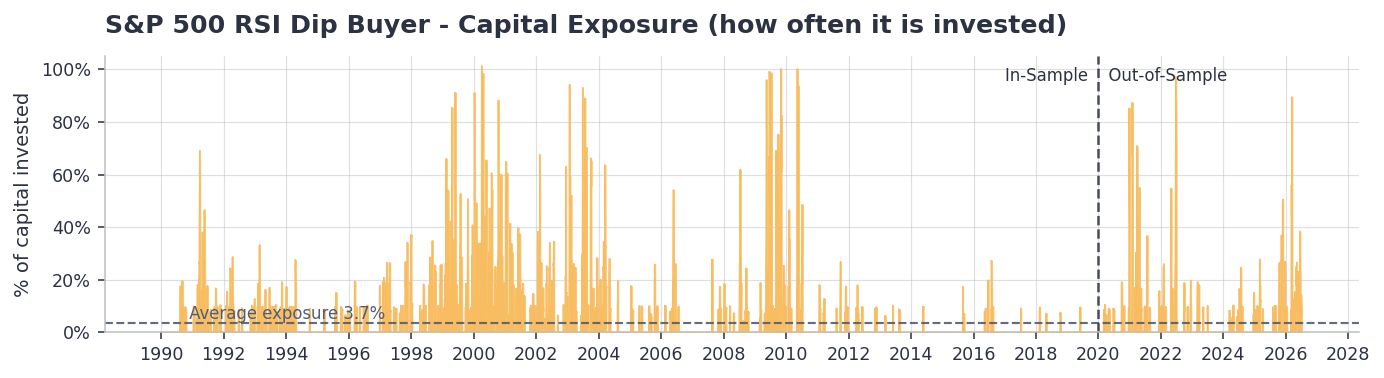
For most of the last three decades the system is barely invested at all. Its average exposure is under 4%, which means the account is sitting in cash the overwhelming majority of the time. Then, when panic actually hits the market, it loads up fast – reaching for close to the full account in 2000, in the 2008 to 2010 stretch, and again around 2020. That is the profile of a satellite system: it earns hard in dislocations, treads water in quiet times, and asks very little of your capital in between. That last point matters, because it means this can sit alongside other systems without hogging your buying power.
The second thing that stood out is where the risk actually lives.
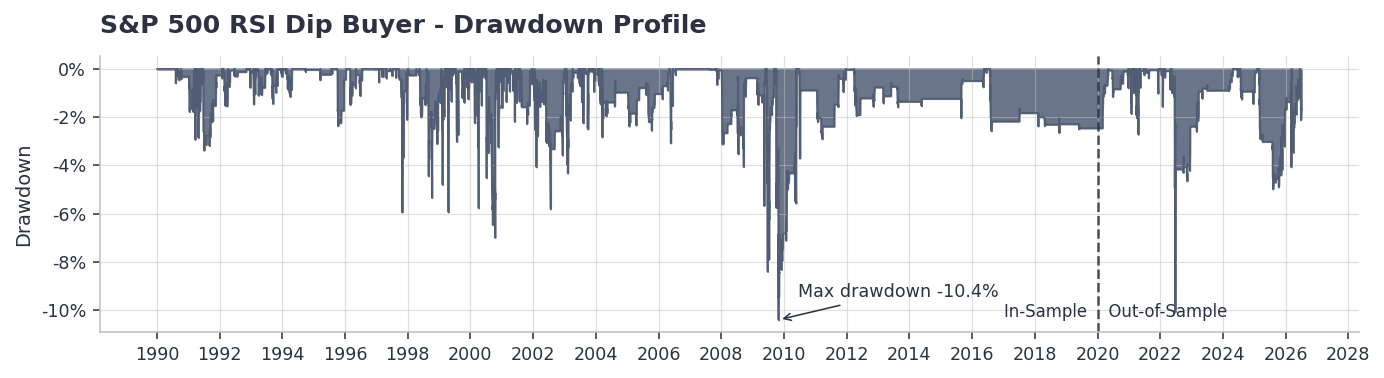
Across 36 years the worst drawdown was 10.4%, which is remarkably contained for a strategy buying falling stocks. But the losses are not spread evenly. The entire downside sits in a small handful of trades where a stock gapped straight down through the exit and there was no chance to get out cleanly. The worst single trades lost more than 20%, and a few lost far more. That is the real cost of buying the dip on deeply oversold names – once in a while, one keeps falling. You control it at the portfolio level, but you cannot make it disappear.
Can you improve a buy the dip strategy with market timing?
This is my favourite part, because it is where being systematic saves you from yourself.
It seemed obvious that the buy the dip strategy should perform better if I only let it trade when the broad market was itself weak or volatile – the conditions that produce the best dips. So I brainstormed a list of filters and tested each one properly. Here is what happened.
- Only trade when the broad market is below its trend. Rejected.
- Only trade when the market is well off its highs. Rejected.
- Only trade when broad-market volatility is elevated. Rejected.
- Only trade when the market is both weak and volatile. Rejected.
- Cap the number of positions in any one sector. Still on the list for a later pass.
Every market-timing filter I tried for this article made the system worse, not better. Each one lifted the quality of the average trade, which is what fooled me at first, but each one also stripped out so many trades that the overall result fell. The stock-level selection was already doing the job. Adding a market-level opinion on top just got in the way.
That is a lesson worth more than any single system: your instinct about what should help is a hypothesis, not a fact. Test it, and let it lose.
Does the buy the dip strategy survive out-of-sample?
This is the only test that truly counts.
Everything above was developed on data from 1990 to the end of 2019. The years from 2020 onward were locked away and never touched during development. Once the system was finished, I ran it forward on those unseen years for the first time. This is the moment a system either proves it found a real edge or exposes itself as a curve fit.
On every chart in this article, the dashed vertical line marks that boundary. Everything to the right of it is data the system had never seen while it was being built. Look back at the equity curve and you will notice the out-of-sample climb is shallower than the steep in-sample runs – the shape changed, and the table below puts numbers on exactly how much.
| Metric | In-Sample (1990-2020) | Out-of-Sample (2020-2026) | Full (1990-2026) |
|---|---|---|---|
| CAGR (annualised) | 5.39% | 3.08% | 4.98% |
| Max Drawdown | -10.39% | -10.04% | -10.39% |
| MAR Ratio | 0.52 | 0.31 | 0.48 |
| Sharpe Ratio | 0.86 | 0.59 | 0.82 |
| Win Rate | 69.8% | 67.4% | 69.4% |
| Avg Win | 5.77% | 4.52% | 5.58% |
| Avg Loss | -6.22% | -5.41% | -6.08% |
| Profit Factor | 1.79 | 1.72 | 1.77 |
| Total Trades | 989 | 187 | 1,176 |
| Avg Exposure | 3.81% | 3.60% | 3.76% |
Look at what held. The win rate barely moved, from 69.8% to 67.4%. The profit factor held almost perfectly, 1.79 to 1.72. The drawdown was identical. The system kept trading at the same pace and kept its exact character on unseen data. It was recognisably the same buy the dip strategy.
And it was positive in every single out-of-sample year, including the 2022 bear market, where it went defensively flat rather than losing. That is a lot to ask of a long-only system.
Now the part I won’t dress up. The risk-adjusted return did step down. The MAR ratio fell from 0.52 to 0.31. It stayed above the line I require, and roughly 60% of the edge carried through, which is actually better retention than several systems I have accepted. But it is a real drop. Most of it is explained by the simple fact that the out-of-sample window never handed the system a 2000-scale dislocation to feast on. The engine was fine. The road was calmer.
What is the verdict on the buy the dip strategy?
The buy the dip strategy passed. Not with a flawless report card, but with a genuine, durable edge that behaved consistently across 36 years and held its character on data it had never seen. That earned it a place in incubation – live monitoring with no real capital at risk – rather than an immediate promotion. Incubation is where I watch whether the live edge tracks the backtest before it ever gets funded.
If there is one thing to take from this, it is this. Do not judge a system by its headline return. A tame-looking 1% starting point hid a real edge that just needed deploying, and the flashiest in-sample curve in the world means nothing until it survives the years you never trained it on. The backtest you tuned will always look good. The one that counts is the one you have never seen.
That gap – between a number that looks good and a system you can actually trust – is the whole game. Closing it is a process, and it is a process you can learn.
Learn to test a buy the dip strategy (and more) yourself
Every system I trade goes through this same scientific process – a real edge, explained, deployed, stress-tested, and proven on unseen data before a dollar is risked. It is the difference between hoping a strategy works and knowing where its edge lives and where it fails.
If you want to build and test your own systems to this standard, that is exactly what the Trader Success System teaches, step by step, with the guidance to get you there.
Remember – you are only one trading system away.