Six gold systems built on price alone failed my testing. So I stopped looking at gold and started watching the market that drives it – US interest rates. Here is what 22 years of data says about gold and interest rates, and how one market can tell you when to own another.
I have a confession to make about gold. Before this system, I had tested six different gold and silver trading systems, and every one of them failed. Trend following, breakouts, rules for each individual metal. Different mechanics, same result. Each time, the apparent edge turned out to be the 2009 to 2011 gold boom and nothing more. Take that one period out and there was nothing repeatable left.
After the sixth rejection I wrote myself a note: stop asking gold’s price chart when to own gold. It has nothing more to tell you. Ask what drives gold instead.
The answer every economics textbook gives is interest rates. So I put the relationship between gold and interest rates on trial as a fully rules-based system. It watches the US 10-year Treasury yield and only holds gold when rates are in an easing phase. The rest of the time it sits in cash.
This is the story of that test. I will show you the interest rate charts it reads, what gold did with and without it, and the complete performance record. I am not publishing the exact rules in this article, because the system is now in incubation and there is an edge to protect. But if you want them, there is a way to get them at the end.
Here is the result that made me sit up.
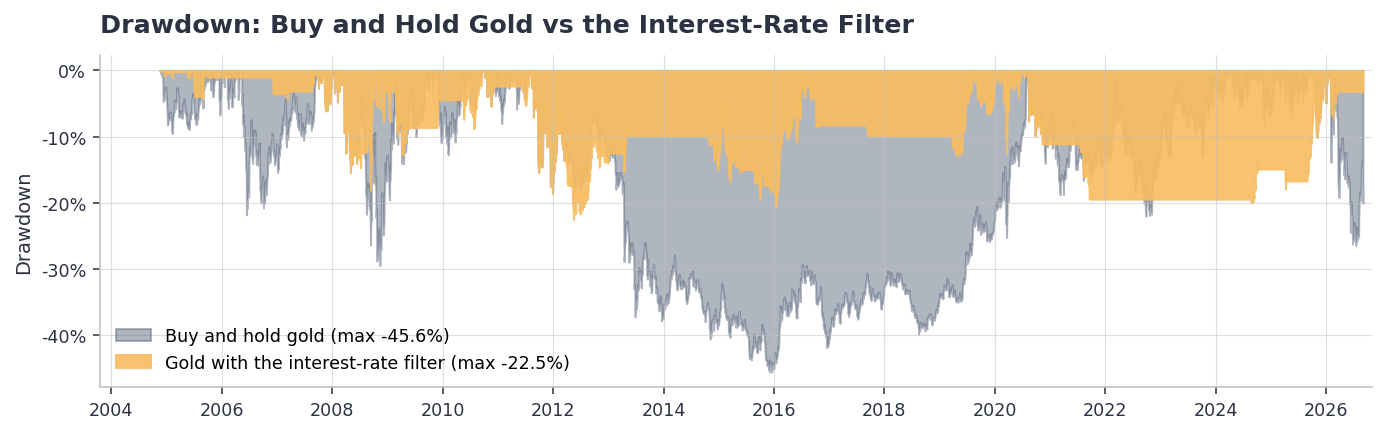
Over 22 years, owning gold outright meant sitting through a 45.6% drawdown. Owning the same gold only when interest rates said so cut the worst drawdown to 22.5% – less than half. Same metal. Half the pain. That protection came at a price, though, and I will be straight with you about exactly what it cost.
What is intermarket analysis?
Intermarket analysis is the idea that markets do not move in isolation. Bonds, currencies, commodities and stocks are all connected, and a trend in one market can tell you something useful about another.
Most traders only ever look at the chart of the thing they are trading. An intermarket approach asks a different question. What else moves before, or alongside, this market – and can I measure it?
The classic relationships are well known. Rising bond yields tend to pressure stocks. A falling dollar tends to help commodities. Falling interest rates tend to help gold.
The problem is that “tend to” is not a trading system. Plenty of intermarket relationships sound convincing in a market commentary and fall apart the moment you define them precisely and test them. So my rule is simple: if you cannot test it, you should not trade it. An intermarket signal earns its place only if it beats the same market traded without it.
To see why interest rates might be the market to watch, look at what rates have done over the long run.
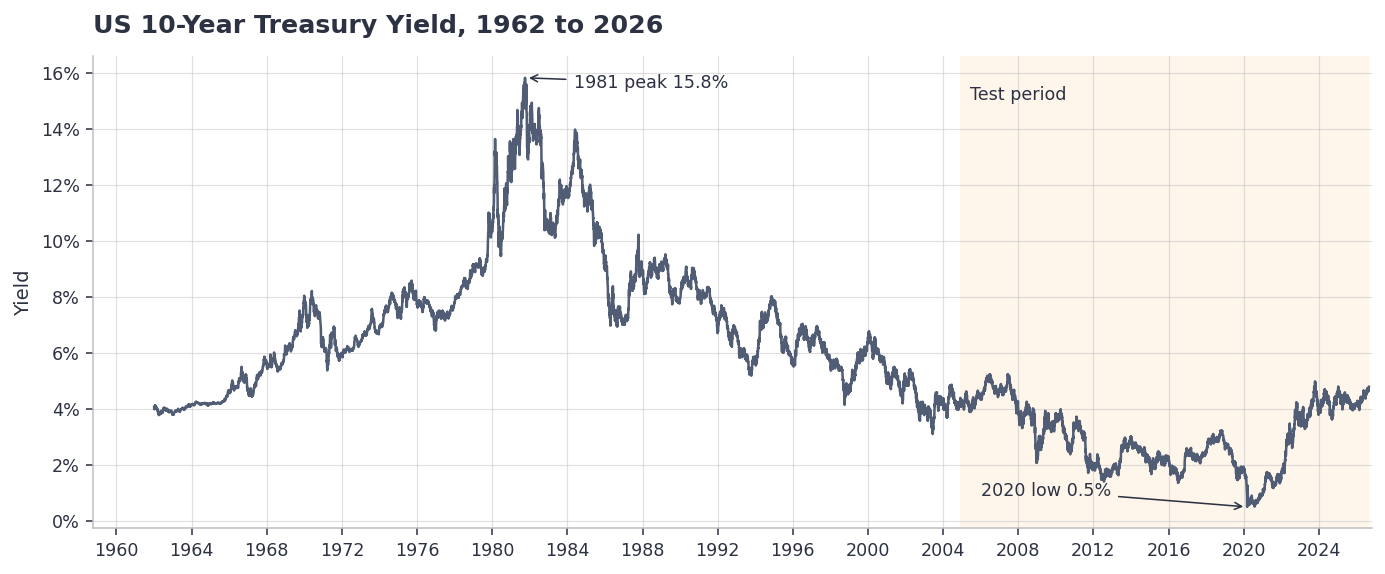
For most of the last half century, the 10-year yield was in one long regime: a 40-year decline from 15.8% in 1981 to 0.5% in 2020. Then that regime ended, fast. By 2023 the yield was back near 5%.
That is the key word – regime. Interest rates do not flip direction every week. Central banks move in cycles that last years, and bond yields trend with them. A market that trends for years at a time is exactly the kind of market that can make a good signal.
How are gold and interest rates connected?
Gold is an unusual asset. It pays no interest, no dividend and no coupon. Its entire return is the change in its price.
That makes the link between gold and interest rates an opportunity-cost story. When a 10-year Treasury pays 5% a year, every dollar sitting in gold is giving up that 5%. Holding gold is expensive. When yields fall to 2%, or 1%, the cost of holding gold shrinks to almost nothing. Gold becomes cheap to own, and money that had been earning a solid yield in bonds starts looking for somewhere else to go.
There is a second reason. Falling rates rarely happen in a vacuum. Central banks cut rates when they are worried – about growth, about a crisis, about confidence. Those are the environments where investors look for a store of value, and gold has filled that role for thousands of years.
So the theory says gold should do best when interest rates are falling and in an easing regime, and struggle when rates are rising. Here is what that looks like in the data.
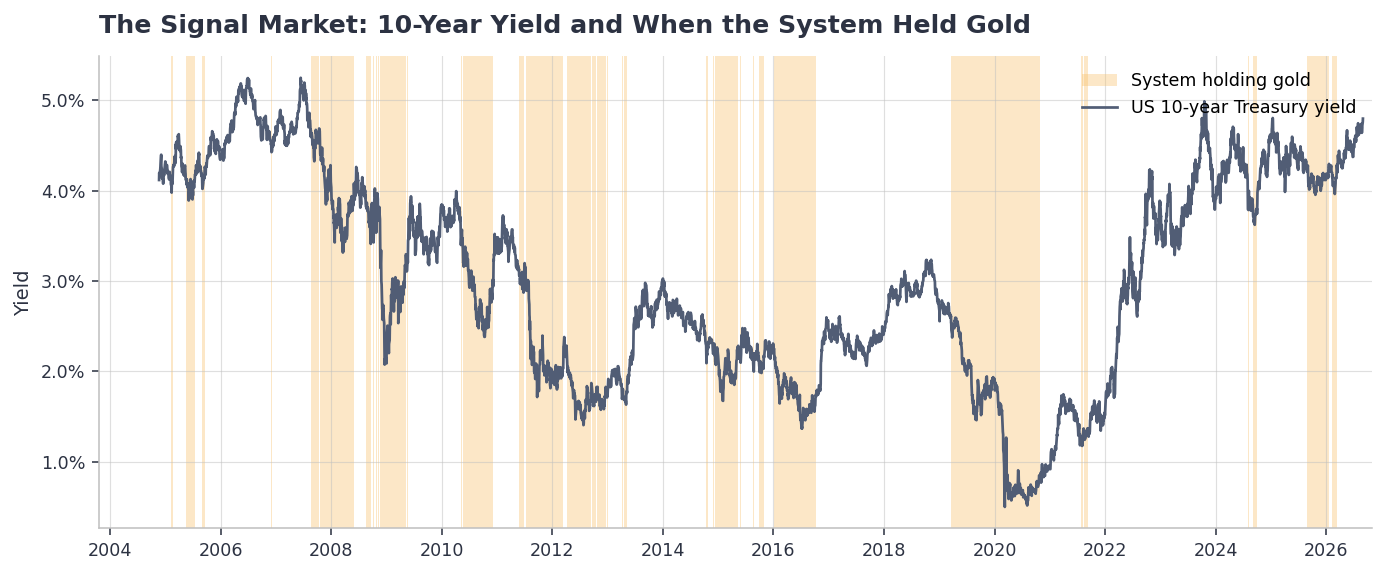
The shaded bands are the periods when the system held gold. Notice where they sit: the 2007 to 2008 rate collapse, the long slide through 2010 to 2012, and the 2019 to 2020 plunge to the lowest yields in history. Notice where they are absent: the 2013 yield spike, the 2017 to 2018 rise, and the entire 2022 to 2023 hiking cycle.
Now look at the same bands on gold itself.
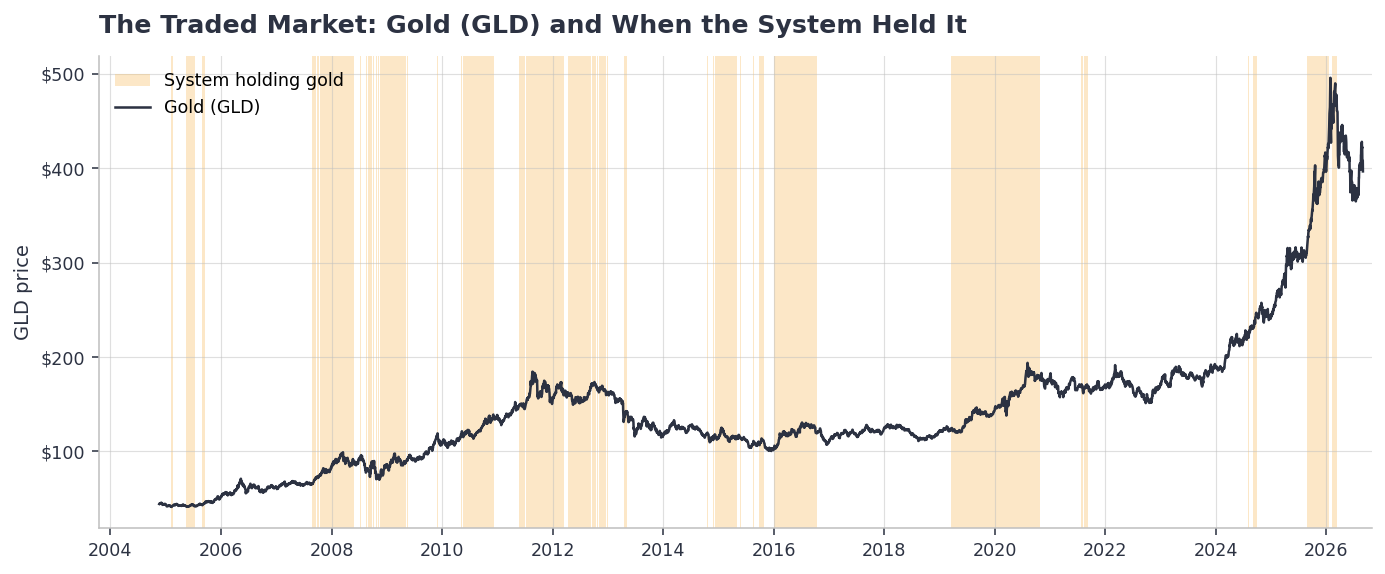
The system held gold for the 2008 and 2020 surges, and it was in cash for most of 2013, when gold fell 28% in a single year. The system finished 2013 up 3.9%. That is intermarket analysis doing its job: a signal from the bond market deciding when to be in the gold market.
What would make me reject it?
This idea came with a kill switch, and I set it before running a single test.
A gold system filtered by interest rates had to beat two things. The first was simply buying and holding gold. The second – and this is the one most people forget – was gold traded with an ordinary price-only trend filter: own it when it is above its long-term moving average, sell it when it is below.
That second benchmark matters to me. My usual approach to gold is to trade what the price is telling you, not what economic theory says should happen. If an interest rate filter could not beat a plain price trend filter on gold, it would just be a complicated way of doing something simpler, and it would be rejected.
The final test: it had to hold up on years of data it had never seen.
What happened when I first tested it?
It failed.
The original design did not use interest rates directly. It used the US dollar index, on the logic that a falling dollar and falling real yields are two sides of the same coin for gold. It is the most popular version of this idea you will find.
The result was dismal. A compound annual return of 1.97%, a 35.4% drawdown, and a return-to-drawdown ratio (MAR) of 0.06. Buy-and-hold gold scored 0.17 over the same years. The dollar filter was far worse than doing nothing at all.
I could have stopped there and filed it as rejection number seven. Instead I did what the idea itself called for: test the whole family of rate-related signals, not just one version, and let the data choose.
- The US dollar index trend. Dead. It never beat the price-only benchmark.
- A market-based real yield measure, comparing inflation-protected Treasuries with regular ones. Dead, and worse than the dollar.
- The trend of the plain 10-year Treasury yield. It worked, and it beat both benchmarks.
The simplest measure of interest rates was the one with the edge. The textbook says gold follows real yields. The data said the plain 10-year yield was the cleaner signal. That is exactly why you test instead of assuming.
What does the gold and interest rates system actually do?
Here is the shape of the machine, without the exact settings.
It trades one instrument, GLD, the largest gold ETF. It is long or flat – fully in gold, or fully in cash. It never shorts.
The only thing it reads is the US 10-year Treasury yield. It measures the trend of that yield on two timescales using simple moving averages: a medium-term view, and a much slower one that defines the broader rate regime. When both agree that rates are in an easing phase, it owns gold. When either one disagrees, it sells and waits in cash.
There is no stop loss, no profit target and no forecasting. It does not care what gold’s own chart is doing. Decisions are made at the end of the day, and orders go in at the next open. Most weeks it does nothing at all. All testing used end-of-day data from Norgate Data, with commission and slippage charged on every trade.
The specific moving-average lengths, and the precise way the two conditions are combined, are what I am keeping back here. That is the part you can get at the end of the article.
We then optimised it, kept the most recent years locked away during development, and put every rule and parameter through significance and robustness testing – the same full process every system in my pipeline goes through, and exactly what I teach inside the Trader Success System. The detail of how that testing is done stays in the classroom. What survived is below.
Gold and interest rates in practice: with the filter vs without
Start with the benchmark every gold investor knows: just buy it and hold it.
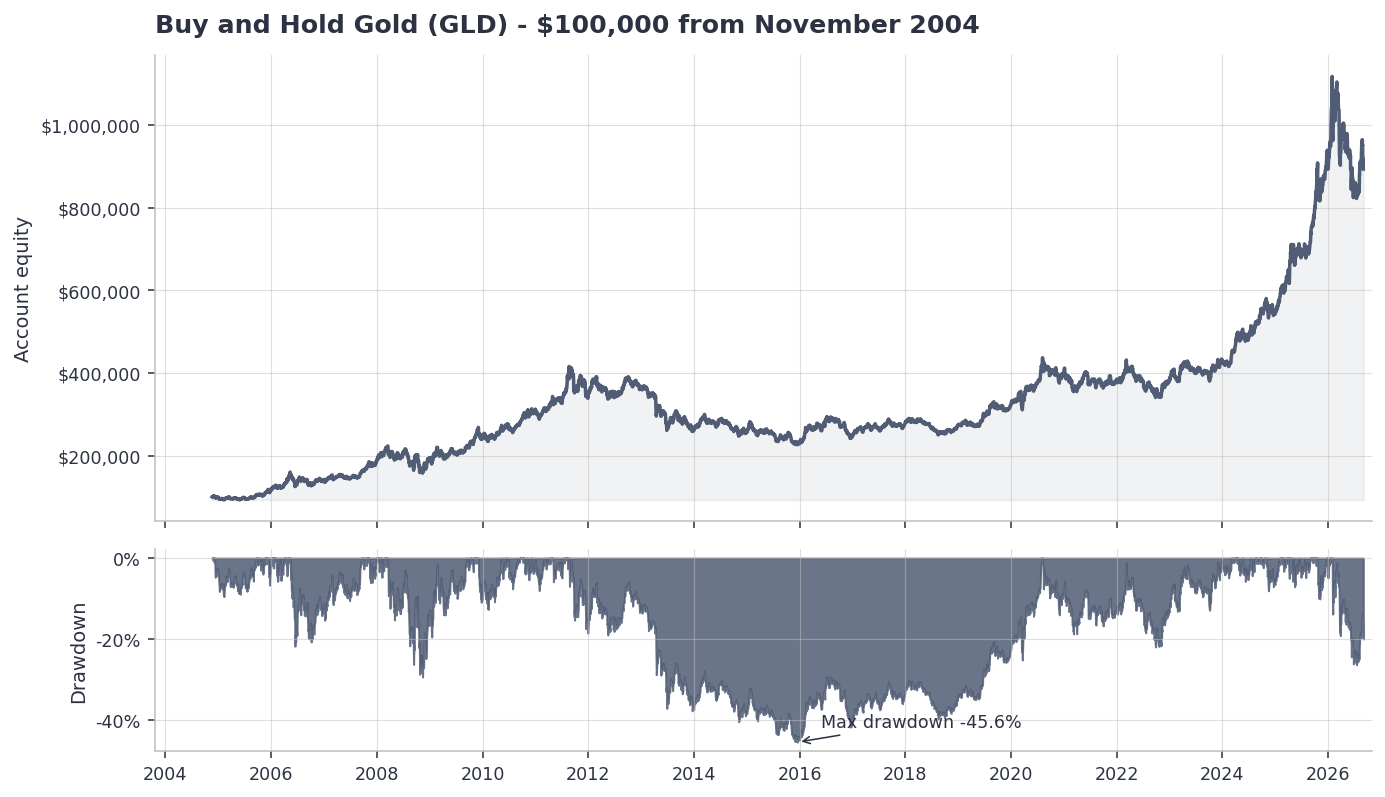
$100,000 put into gold in November 2004 grew to $893,124 by September 2026 – a compound annual return of 10.57%. A great result on paper. Now look at the bottom panel. From the 2011 peak, a buy-and-hold gold investor sat through a 45.6% drawdown and did not get back to even until 2020. Almost nine years underwater. Very few people actually hold through that. If you want to understand why the drawdown matters more than the return, read my guide to drawdown in trading.
Now the same gold, owned only when interest rates were in an easing regime.
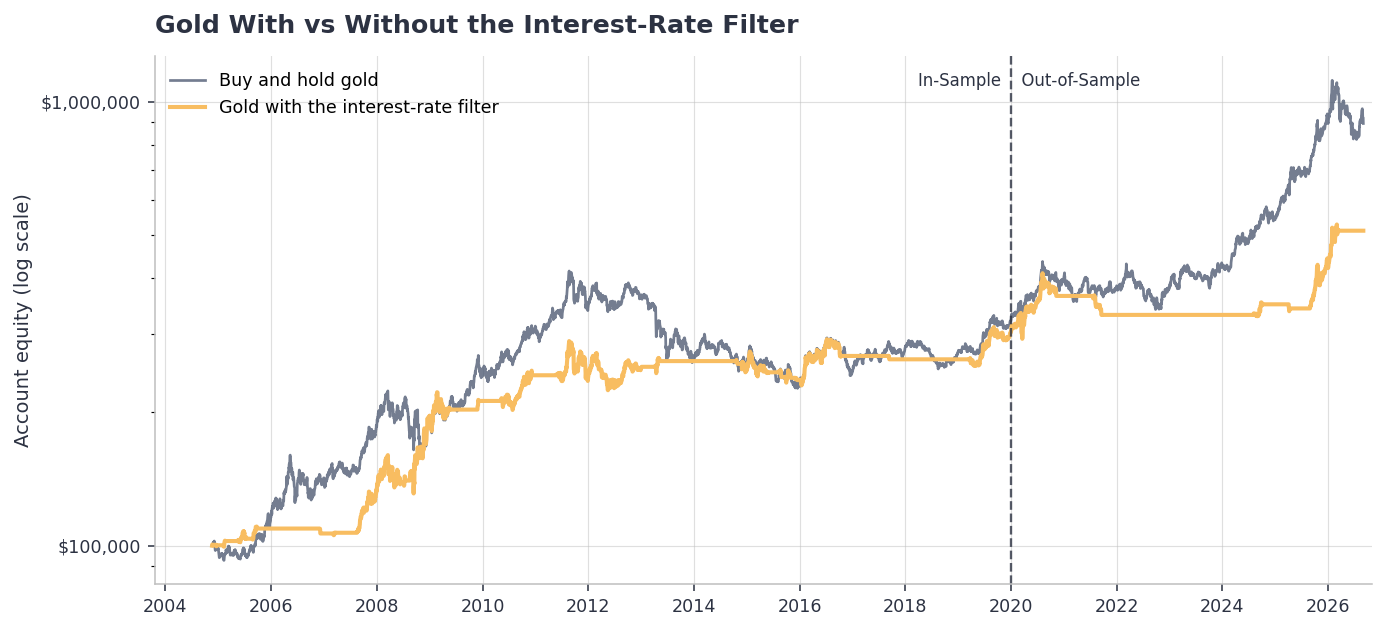
I want to be honest about what this chart shows, because it is the most important picture in this article. Buy-and-hold gold finished with more money: $893,124 against $512,147 for the interest rate filter. The filter compounded at 7.75% a year against gold’s 10.57%.
So why would anyone want the filtered version? Because of what it asked of you along the way.
| 2004-2026 | Gold with the interest rate filter | Buy and hold gold | Gold with a price-only trend filter |
|---|---|---|---|
| CAGR (annualised) | 7.8% | 10.6% | 7.7% |
| Max Drawdown | -22.5% | -45.6% | -34.5% |
| MAR Ratio | 0.34 | 0.23 | 0.22 |
| Time in the market | 35% | 100% | 66% |
On a risk-adjusted basis – how much return you earned for each unit of drawdown you had to sit through – the interest rate filter beat both benchmarks. It matched the price-only trend filter’s return with about a third less drawdown and roughly half the time in the market. And it did it while holding cash for almost two-thirds of the 22 years, cash that is free to do other work in a portfolio.
Here is the year-by-year record, so you can see this is not one lucky year.
| Year | Gold with the interest rate filter | Buy and hold gold |
|---|---|---|
| 2004 (from 18 Nov) | 0.2% | -1.6% |
| 2005 | 9.1% | 17.8% |
| 2006 | -2.5% | 22.6% |
| 2007 | 24.6% | 30.5% |
| 2008 | 47.8% | 4.9% |
| 2009 | 7.9% | 24.1% |
| 2010 | 14.2% | 29.3% |
| 2011 | -1.8% | 9.6% |
| 2012 | 5.5% | 6.6% |
| 2013 | 3.9% | -28.4% |
| 2014 | -4.8% | -2.2% |
| 2015 | -4.8% | -10.7% |
| 2016 | 13.3% | 8.0% |
| 2017 | -1.7% | 12.8% |
| 2018 | 0.0% | -1.9% |
| 2019 | 15.1% | 17.9% |
| 2020 | 20.6% | 24.8% |
| 2021 | -9.4% | -4.2% |
| 2022 | 0.0% | -0.8% |
| 2023 | 0.0% | 12.7% |
| 2024 | 5.6% | 26.7% |
| 2025 | 20.7% | 63.7% |
| 2026 (to 1 Sep) | 21.4% | 0.1% |
Gold beats the filter in most strong gold years. That is the cost of sitting in cash. But look at the bad years. The filter had six losing years, and the worst was -9.4%. Gold had seven, and the worst was -28.4%. That is the real case for this gold and interest rates system. It is not a way to beat gold. It is a way to own gold with far less pain.
What does the final system’s equity curve look like?
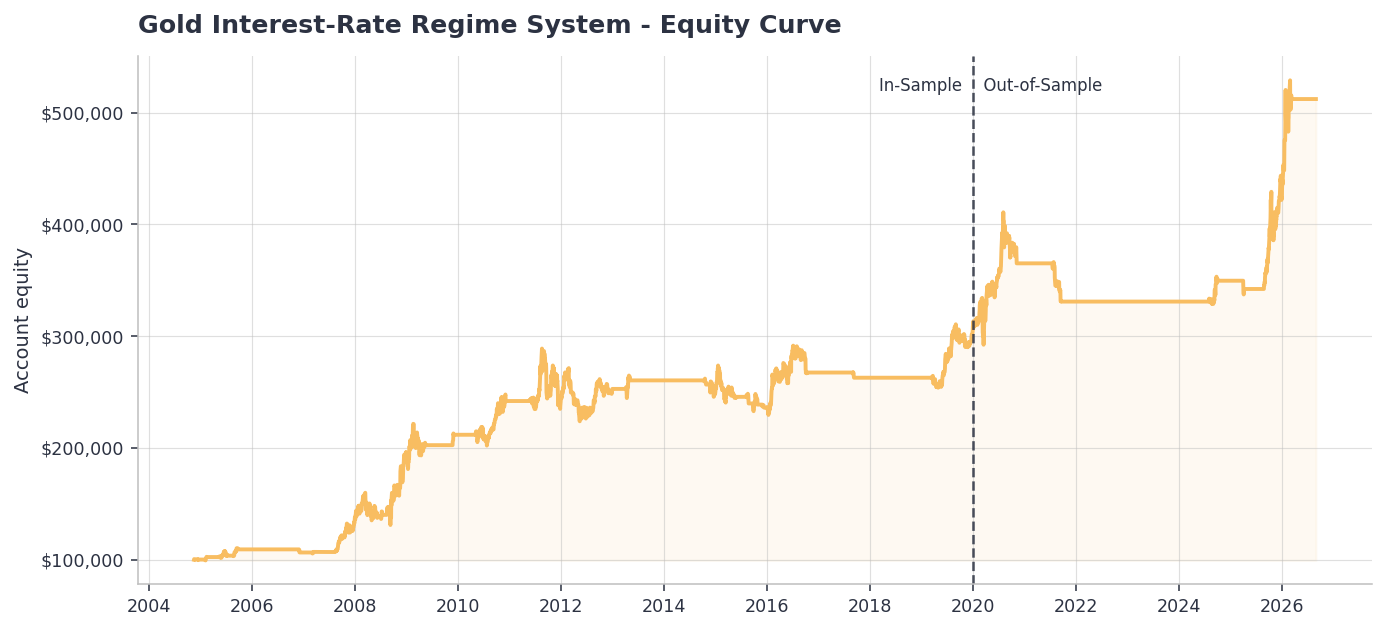
$100,000 grew to $512,147 over 22 years. The flat stretches are the point. Those are the years interest rates were rising and the system simply sat in cash: mid-2013 to late 2014, late 2016 to early 2019, and late 2021 to mid-2024.
You can see just how rarely it commits capital here.
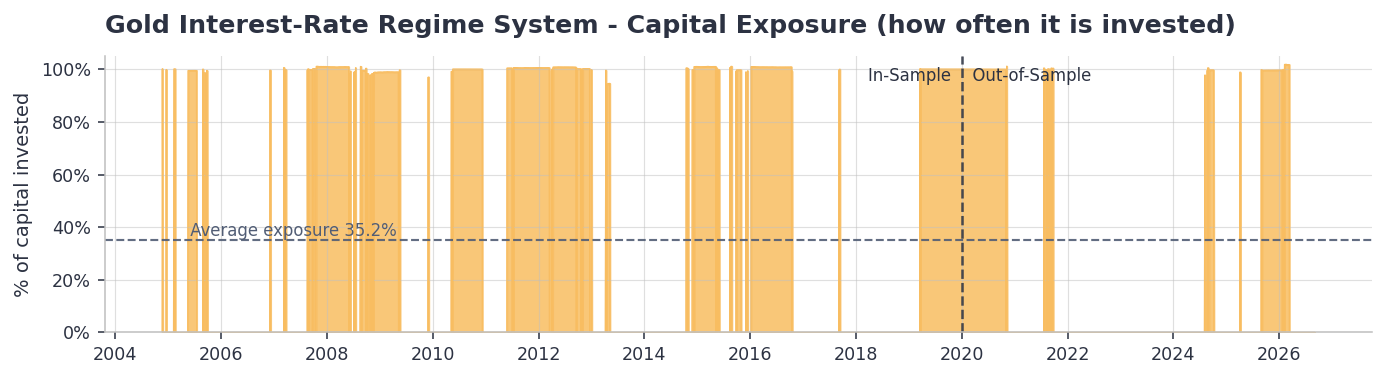
When it is in, it is all in. When it is out, it is completely out. Average exposure across 22 years was 35.2%.
The trade profile is typical of a trend-following system. It wins less than half the time – 48.2% of trades – but the average winner (6.11%) is more than four times the size of the average loser (1.39%). Most of the losing trades are small in-and-out moves when the yield hovers right around its trend, which you can see as the thin slivers of shading on the charts. The profit factor over the full period was 3.46.
What did we try to improve it?
Once the core signal worked, I brainstormed ways to make it better and tested each one. Here is the list and what happened.
- Also require gold’s own price to be in an uptrend. Rejected. It entered late and diluted the rate signal.
- Also require the US dollar to be falling. Rejected, for the same reason.
- Require a sustained easing regime, not just a short dip in yields. Kept. This was the single biggest improvement, because it keeps the system out of brief rate dips inside a rising-rate era.
- Own gold when either rates or gold’s price trend say so. Not adopted. It lifted returns but brought back a price-based rule and a deeper drawdown.
- Hold 2x leveraged gold instead of GLD. Tested, not adopted. It roughly matched buy-and-hold gold’s return and drawdown while in the market only about a third of the time, but it was no better on a risk-adjusted basis.
- Apply the same filter to silver and gold miners. Both improved. It cut silver’s worst drawdown from 76% to 42%, and the gold miners’ from 80% to 51%.
That last result is one I give a lot of weight to. An edge that only works on the one market you built it on is often a curve fit. The same interest rate filter improving three different precious-metals markets is strong evidence the relationship is real.
Does the gold and interest rates signal hold up out-of-sample?
Everything above was developed on data from November 2004 to the end of 2019. From 2020 onwards the data was locked away and never touched. Once the system was finished, I ran it forward on those unseen years for the first time. On the charts above, the dashed vertical line marks that boundary.
Those years were a genuinely hard test: COVID, the fastest rate-hiking cycle in 40 years, and a gold bull market that kept running even while rates stayed high.
| Metric | In-Sample (2004-2019) | Out-of-Sample (2020-2026) | Full (2004-2026) |
|---|---|---|---|
| CAGR (annualised) | 7.56% | 8.12% | 7.75% |
| Max Drawdown | -22.51% | -20.00% | -22.51% |
| MAR Ratio | 0.34 | 0.41 | 0.34 |
| Sharpe Ratio | 0.63 | 0.78 | 0.67 |
| Win Rate | 51.6% | 40.0% | 48.2% |
| Avg Win | 4.75% | 10.39% | 6.11% |
| Avg Loss | -1.20% | -1.90% | -1.39% |
| Profit Factor | 3.62 | 3.30 | 3.46 |
| Total Trades | 64 | 20 | 83 |
| Avg Exposure | 40.3% | 23.9% | 35.3% |
One position was open across the in-sample / out-of-sample boundary, so it is counted in both windows but only once in the full period.
The edge did not fade on unseen data. The MAR ratio rose from 0.34 to 0.41. The compound return edged up, and the drawdown was smaller. The win rate dropped, but the average winner more than doubled, which is what you would expect when the system catches fewer, larger rate-driven moves.
It also did exactly what it was designed to do in the 2022 to 2023 hiking cycle: nothing. It sat in cash for both years and returned 0%.
Now for the part I will not dress up. In the out-of-sample years, buy-and-hold gold compounded at 16.4% a year against the system’s 8.1%. Gold went on a historic run, and a lot of that run happened in 2024 and 2025 while US yields were still high. The system caught some of it – 20.7% in 2025 – but gold itself returned 63.7% that year.
This is something I say often: correlations between markets are not stationary. The relationship between gold and interest rates is real, but it is not a law of physics. In 2024 and 2025 gold found other reasons to rise, and a system that only listens to interest rates will miss moves like that. You have to accept that trade-off when you choose this kind of filter.
Then 2026 showed the other side. The system held gold from September 2025, and its best trade of the entire test ran into January 2026 for a 36.5% gain. A few short trades followed, and on 12 March the system moved to cash as the 10-year yield turned back up – from 3.96% in late February to 4.94% by 10 September. Gold peaked on 29 January and fell 26% into July. As at 1 September, buy-and-hold gold was up just 0.1% for 2026. The interest rate filter was up 21.4%, sitting in cash, with a drawdown of 3.2%.
What is the verdict?
The gold and interest rates system passed, and it entered incubation on 25 August 2026. Incubation means I track it live with no real capital at risk, to confirm the live signals match the backtest before any money goes in.
It passed with a clear job description. It is not a return enhancer. In a raging gold bull, buy-and-hold will beat it, and I have shown you by how much. What it does is give you gold-like returns with roughly half the drawdown, while leaving your capital free two-thirds of the time. In a portfolio, that is a very useful thing to own.
The broader lesson is the one that got me here. When a market refuses to give up an edge on its own chart, stop staring at that chart. Ask what drives the market, find the market that measures that driver, and test whether its trend makes a better signal. Then hold it to a fair standard: it has to beat the market traded without it, beat a simple price-only filter, and do both on data it has never seen.
Six gold systems failed that test on price alone. The seventh passed by listening to the bond market.
Get the complete rules for this gold and interest rates system
I have shown you the charts, the results and the shape of the system. What I have held back are the exact rules: the two moving-average lengths, precisely how the conditions combine, and the entry and exit logic, ready to code into your own backtesting software.
If you want them, get the complete rules here. I will send you the full rule set so you can test this gold and interest rates system for yourself.
And if you want to learn to build and test your own intermarket systems to this standard, that is exactly what the Trader Success System teaches, step by step.
Remember – you are only one trading system away.