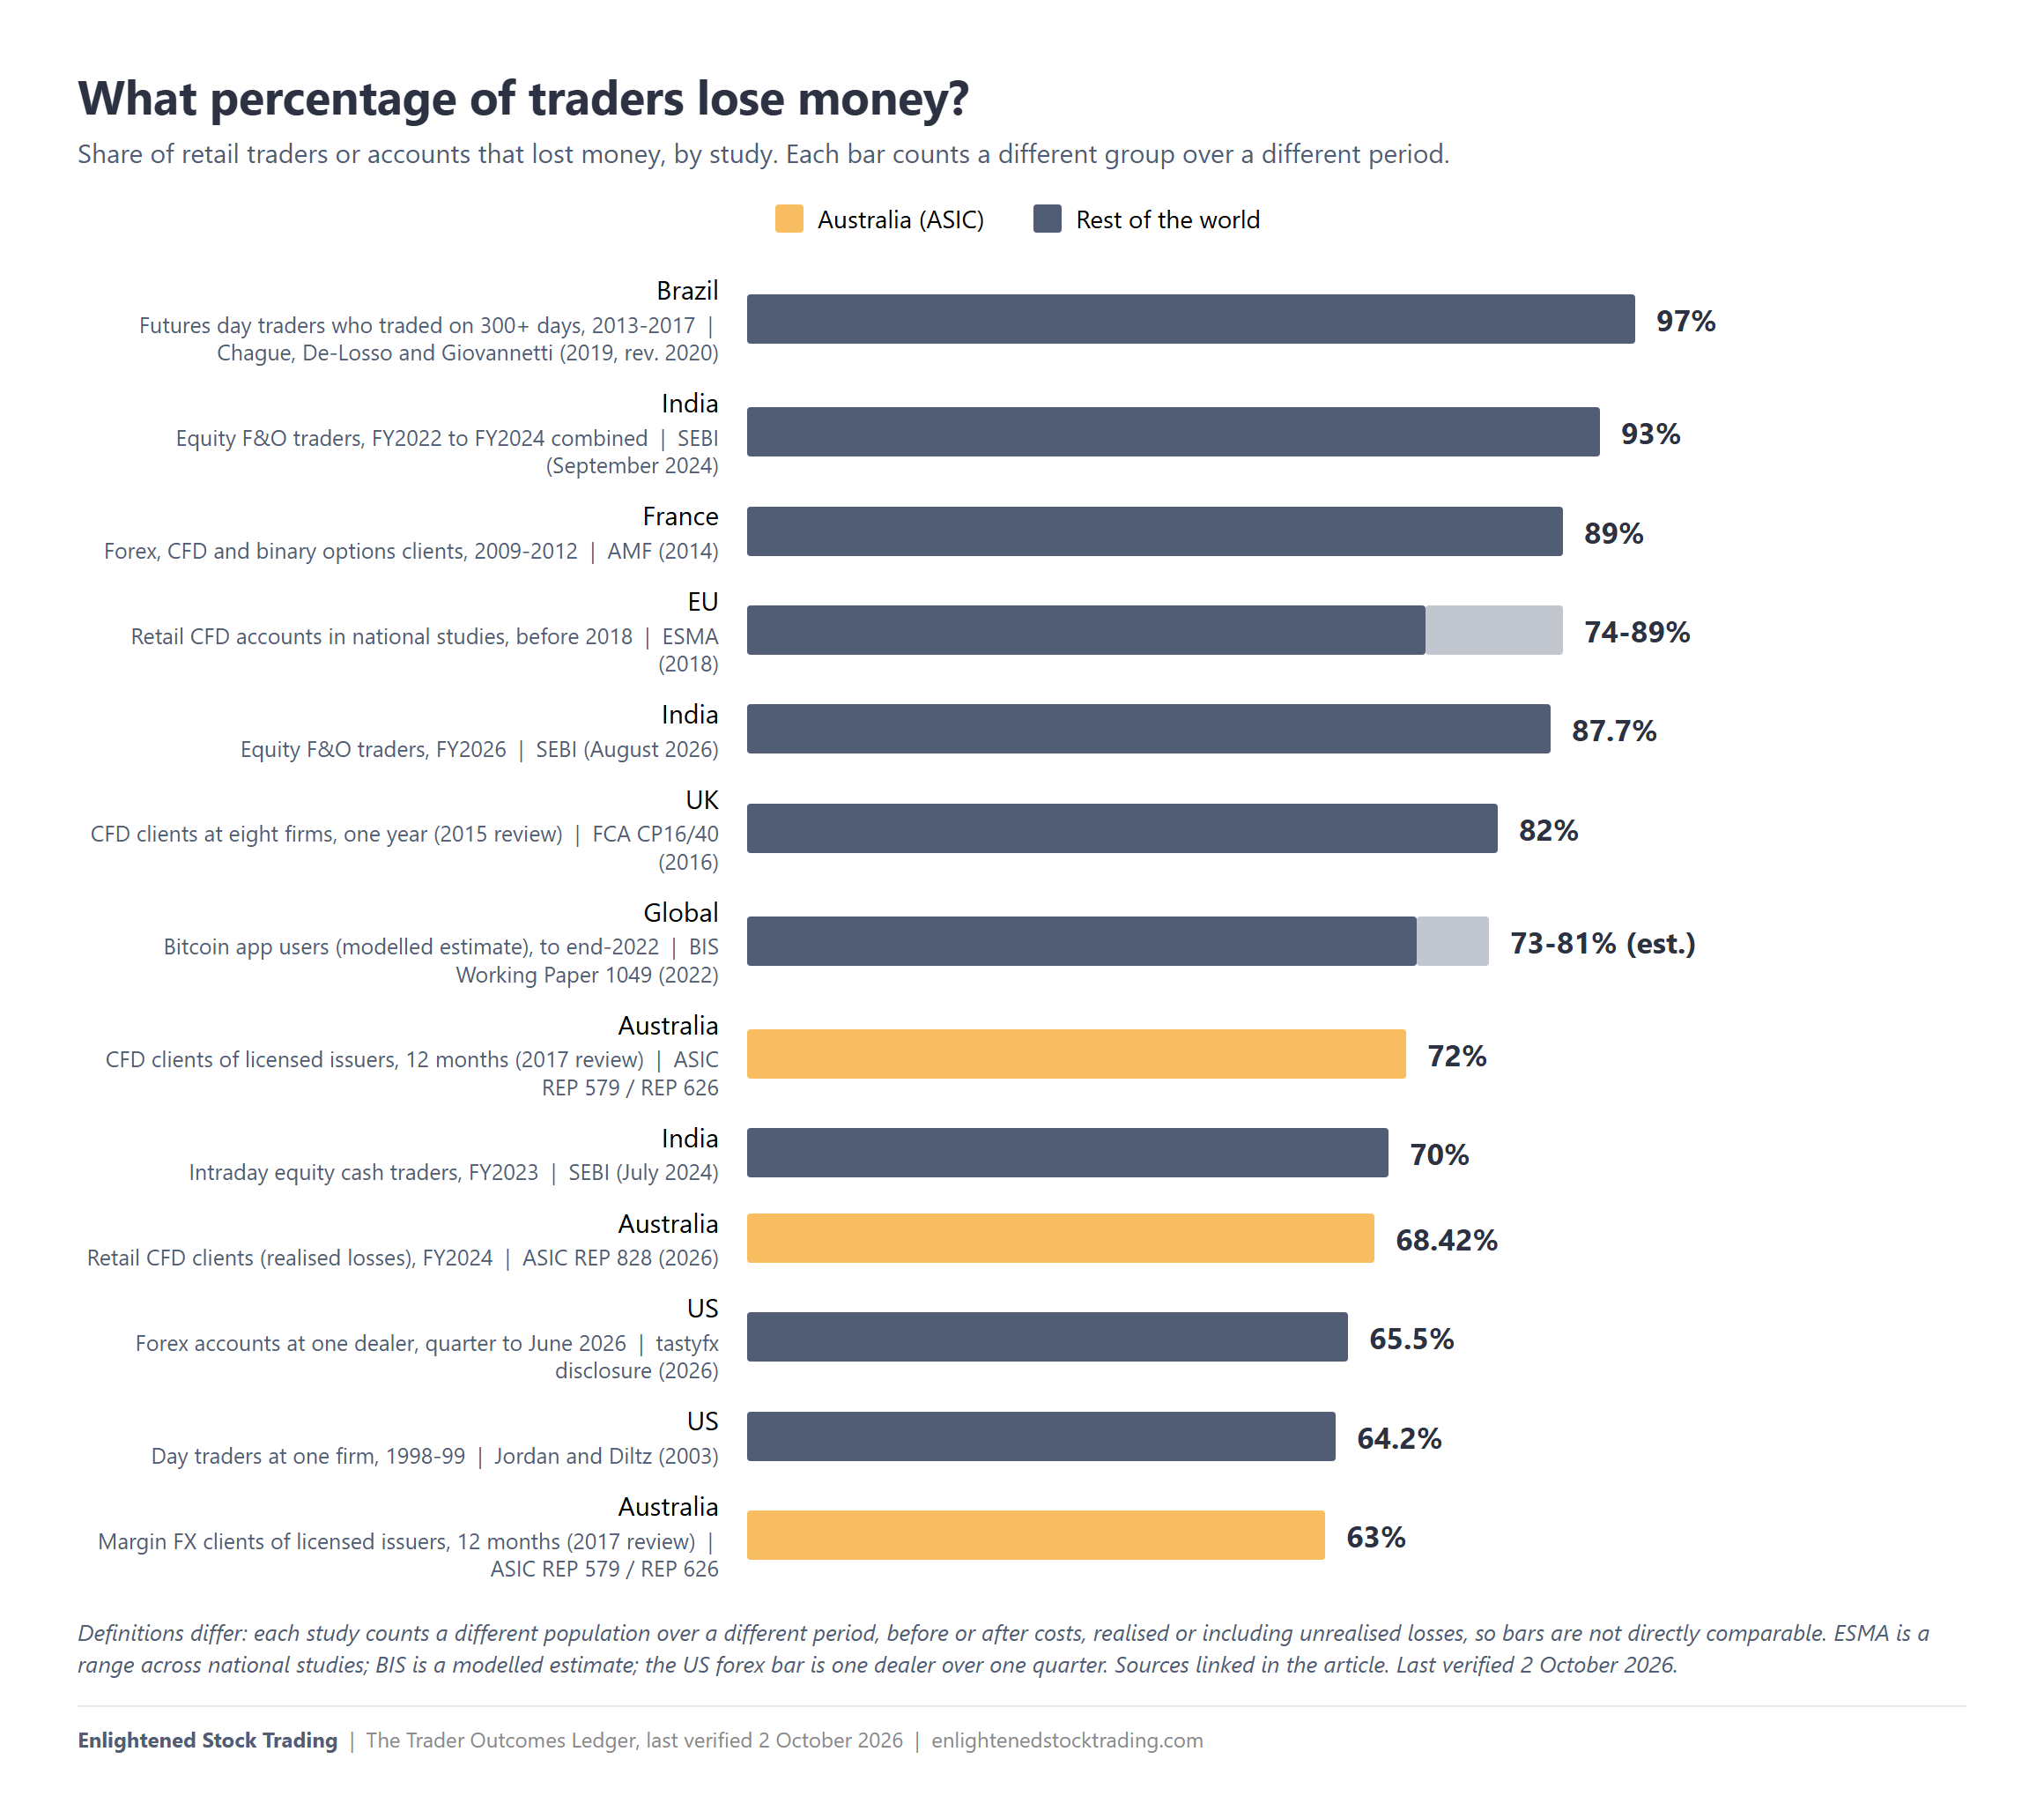
Measured over a year or longer, between 63% and 97% of retail traders lost money in the studies that counted individual accounts, depending on the market, the product and the period. The most recent regulator figures sit inside that range: 68.42% of retail CFD clients of Australian-licensed issuers realised a net loss in FY2024, and 87.7% of individual equity futures and options traders in India made a net loss in FY2026. Each study counts a different group and defines “lose” differently, so every number here comes with who was measured, what counted as losing, the period and a link to the primary source.
Trader loss rates and day trading statistics at a glance (last verified 2 October 2026)
| Study | Country | Market | Who was measured | Share who lost | Period | Source |
|---|---|---|---|---|---|---|
| Chague, De-Losso and Giovannetti (2019, rev. 2020) | Brazil | Mini-index futures, day trading | People who started in 2013-2015 and day traded on more than 300 days | 97% | 2013-2017 | FGV working paper |
| Barber, Lee, Liu and Odean (2014) | Taiwan | Stocks, day trading | About 360,000 day traders a year | Only 13-15% profitable after fees in a typical year; under 1% predictably profitable | 1992-2006 | Working paper |
| Jordan and Diltz (2003) | United States | Stocks, day trading | 324 day traders at one firm | 64.2% | Feb 1998 to Oct 1999 | Financial Analysts Journal |
| SEBI (2024) | India | Equity cash, intraday | Individual intraday traders, top 10 brokers | 70% | FY2023 | SEBI release |
| SEBI (2026) | India | Equity futures and options | Individual traders, top 15 brokers | 87.7% | FY2026 | SEBI report (PDF) |
| SEBI (2024) | India | Equity futures and options | Individual traders, top brokers | 93% (three years combined) | FY2022 to FY2024 | SEBI release |
| ESMA (2018) | European Union | CFDs | Retail accounts in national regulators’ studies | 74-89% | Before 2018 (varies) | ESMA release |
| FCA CP16/40 (2016) | United Kingdom | CFDs, spread bets, rolling spot FX | Sample of clients at eight firms | 82% | One year (2015 review) | FCA paper (PDF) |
| AMF (2014) | France | Forex, CFDs, binary options | 14,799 active retail clients | 89% | 2009-2012 (four years) | AMF letter (PDF) |
| ASIC REP 579 / REP 626 | Australia | CFDs, margin FX, binary options | Clients of 57 licensed issuers (most offshore) | 72% CFDs, 63% margin FX, 80% binary options | 12 months (2017 review) | ASIC REP 626 (PDF) |
| ASIC REP 828 (2026) | Australia | CFDs | 195,386 retail clients of 50 licensees | 68.42% (realised) | FY2024 | ASIC REP 828 (PDF) |
| tastyfx disclosure (2026) | United States | Retail forex | 8,801 active accounts at one dealer | 65.5% not profitable | Quarter to 30 June 2026 | tastyfx disclosures |
| BIS Working Paper 1049 (2022) | 95 economies | Bitcoin via exchange apps | Retail app users (modelled estimate) | 73-81% (estimated) | 2015 to end-2022 | BIS |
The whole ledger, 40 entries with the population, definition, period, source and verification status of each, is a free CSV download.
Why do the studies disagree so much?
Because they count different people over different periods, and define losing differently. Four differences move the figure most:
- Who is in the denominator. Brazil’s 97% covers only people who kept day trading for more than 300 days. India’s 87.7% covers every individual who traded equity derivatives at the brokers studied.
- The window. Short windows produce lower loss rates by construction, because a client who loses over a year can still have winning weeks. The AMF found 75-89% of French clients lost money in any single year, and 89% over four years.
- Before or after costs. SEBI found 82.1% of Indian F&O traders lost money before transaction costs in FY2026, and 87.7% after them.
- Realised or unrealised. ASIC’s FY2024 figure counts realised losses only. UK broker warnings count realised and unrealised losses together.
A trader told me on a call, “I’m just hitting the 18-month mark and I’d say I’m break even. I’ve lost a lot of money.” The studies below show how common that is, and what the minority who did better did differently.
What percentage of day traders make money?
Very few, and the share shrinks the longer you measure. In Taiwan, Barber, Lee, Liu and Odean found only about 13-15% of day traders made a profit after fees in a typical year, and fewer than 1% did it predictably, year after year. The most favourable result in the research is Jordan and Diltz, who studied every confirmed trade at seven branches of one US day trading firm from February 1998 to October 1999, during the dot-com boom. 35.8% of 324 day traders were profitable after commissions and 208 (64.2%) had a net loss; 19.4% made more than US$5,000, the average result was a loss of about US$750, and profitability rose and fell with the Nasdaq Composite.
Brazil. Chague, De-Losso and Giovannetti followed people who started day trading mini-index futures between 2013 and 2015. Of those who kept going for more than 300 days, 97% lost money, only 0.4% earned more than a bank teller’s starting salary of about US$54 a day, and the best individual earned about US$310 a day. The authors found no evidence of learning. The 97% does not describe all day traders: secondary summaries put the starting group at 19,646 people, of whom about 7.9% persisted past 300 sessions, as reported by CXO Advisory. A separate 2025 paper using regulator data found 968,512 individuals lost R$9.9 billion day trading futures from 11 March 2020 to the end of 2023, before fees and taxes.
Taiwan. Researchers had every trade in the Taiwanese market from 1992 to 2006, with about 360,000 individuals day trading in an average year. The 2020 follow-up study estimated that 97% of day traders were likely to lose money in future day trading, and found that 74% of day trading volume came from traders with a history of losses. Futures were no better: Kuo and Lin found 3,470 index futures day traders lost an average of NT$61,500 each after costs between October 2007 and September 2008.
Frequent trading hurts investors too. Among 66,465 US households from 1991 to 1996, those with monthly turnover above 8.8% earned 11.4% a year after costs against 17.9% for the market, while the least active earned 18.5% (Barber and Odean). That is underperformance in a strong market, not losses.
Is day trading profitable?
For the typical retail day trader, no. Every account-level study above found most day traders lost money after costs, and the studies that tested for it found no evidence that experience fixed the problem. I trade end-of-day systems and do not teach day trading. But none of these studies measured end-of-day systematic traders.
How many day traders quit?
Most quit within two years. The 2017 working paper version of the Taiwan learning study found more than 75% of day traders quit within two years. Among those with at least 10 days of day trading, 44% were still going after one year, 24% after two and 15% after three. Losing did not make people stop: previously unprofitable traders with 50 or more days of experience had a 95.3% probability of day trading again within 12 months, almost the same as profitable traders at 96.4%. The popular “80% quit within two years, 13% remain after three, 7% after five” version does not appear in the versions we read.
Is forex trading profitable for retail traders?
For most retail clients, no. Regulators in the EU, the UK, France and Australia each found that between 63% and 89% of retail clients lost money on forex and CFDs over the periods they measured. Australia has its own section below.
- European Union. When ESMA restricted CFDs in 2018, it cited national regulators’ analyses showing 74-89% of retail accounts typically lost money, with average losses of EUR 1,600 to EUR 29,000 per client. That is a range across separate national studies, all from before leverage caps.
- United Kingdom. The FCA’s consultation paper CP16/40 (December 2016) sampled client accounts at eight CFD firms: 82% lost money over a year, with an average loss of GBP 2,200.
- France. The AMF tracked 14,799 active retail clients of forex, CFD and binary options providers from 2009 to 2012. 89% lost money over the four years, with an average loss of about EUR 10,900 and a median of EUR 1,843. 13,224 clients lost nearly EUR 175 million between them while 1,575 gained EUR 13.8 million, and the AMF found no learning effect.
- Ireland. The Central Bank of Ireland found in 2015 that 75% of CFD clients lost money, with an average loss of EUR 6,900, as cited by the FCA in CP16/40 (footnote 5). We could not read that study directly.
My own view on why: leverage makes an account swing further than most people can sit through, and the decisions made under that stress are the expensive ones. The Australian data below shows what happened when leverage was capped.
How do broker risk warnings work?
UK and EU CFD providers must publish the share of their own retail accounts that lost money. Under the UK rule (COBS 22.5.6R, FCA PS19/18), an account is losing if its realised and unrealised net profits over the previous 12 months, after all costs, add up to less than zero; the figure is recalculated every three months, and accounts with no open position are left out. US forex dealers publish the share of non-discretionary accounts that were profitable in each of the last four quarters, with break-even counted as not profitable (CFTC). Indian brokers show SEBI’s market-wide finding as a login pop-up (SEBI circular). Australia requires no percentage.
Here is what five providers showed when we read their pages on 2 October 2026:
| Provider | Jurisdiction | Retail accounts that lost money | Window |
|---|---|---|---|
| IG | United Kingdom | 68% | Trailing 12 months |
| IG Europe | Germany | 72% | Trailing 12 months |
| CMC Markets | United Kingdom | 69% | Trailing 12 months |
| Pepperstone | United Kingdom | 72.9% | Trailing 12 months |
| tastyfx (IG’s US forex brand) | United States | 65.5% not profitable, of 8,801 accounts | Quarter to 30 June 2026 |
These are the most current numbers you can cite, but each covers one firm’s clients and changes every quarter: tastyfx’s unprofitable share was 59.16% in the quarter to September 2025 and 64.81% in the quarter to March 2026. For the market-wide picture, use the regulator studies.
What percentage of options traders are profitable?
Nobody has published the share of retail options traders who made money. The research measures aggregate dollars instead, and on that measure retail traders lost money in the two largest US studies, which a Cboe-funded paper disputes.
- Bryzgalova, Pavlova and Sikorskaya (Journal of Finance, 2023) used whole-market US options data from November 2019 to June 2021, identifying retail trades by a trade-type proxy. Retail investors favoured cheap weekly options with an average bid-ask spread of 12.6%. Assuming a 10-day holding period, the aggregate retail portfolio lost US$2.1 billion, and spread costs totalled US$6.4 billion against about US$900 million in commissions.
- Beckmeyer, Branger and Gayda (working paper, December 2023 version) found more than 75% of retail trades in S&P 500 options were same-day expiry (0DTE). From February 2021 to September 2023, retail traders lost US$241,000 on an average day, rising to about US$350,000 a day after daily expiries began in May 2022. Of total losses above US$125 million, more than US$90 million was transaction costs, and single-leg trades drove the losses.
The rebuttal. Amaya, Garcia-Ares, Pearson and Vasquez (working paper, April 2025) used Cboe data that records the actual direction of each trade, and measured performance to expiration rather than over a few days. On that basis, Cboe customer single-leg auction trades were profitable on average, contradicting Bryzgalova and colleagues. The method point is fair, and so is the funding question: the paper was supported by a data grant from The Options Institute at Cboe, Cboe hosts it, and Cboe benefits from retail options volume. The evidence of average retail losses in options is substantial but disputed.
What percentage of Indian F&O traders lose money?
87.7% of individual traders in Indian equity futures and options made a net loss after transaction costs in FY2026, according to SEBI’s August 2026 study of the top 15 brokers, which cover about 90% of equity derivatives traders. That is the lowest share in five years of SEBI data: 90.2% in FY2022, 91.5% in FY2023, 91.1% in FY2024 and 90.9% in FY2025.
- Individual traders lost INR 91,685 crore in aggregate in FY2026, an average of INR 1.17 lakh per trader. (1 crore is 10 million rupees; 1 lakh is 100,000.)
- Before transaction costs, 82.1% lost. Costs turned about 4.4 lakh traders who were profitable before costs into net losers.
- 89% of traders under 30 lost money, against 81% of those over 60.
- Options accounted for 92% of individual losses, and about 23% of traders accounted for nearly 90% of losses.
SEBI itself cautions that the FY2026 improvement coincided with a 20% fall in active traders, so it may reflect who stopped trading rather than better results.
Over three years the picture is worse. SEBI’s September 2024 study found 93% of individual F&O traders lost money across FY2022 to FY2024, with aggregate losses above INR 1.8 lakh crore. An earlier SEBI study of FY2022 found 9 out of 10 individual F&O traders made net losses, and loss-makers spent an additional 28% of their net trading losses on transaction costs.
In the cash market, with only intraday margin, the share is lower but still a majority: SEBI found 7 out of 10 individual intraday traders in the equity cash segment made losses in FY2023. As reported by Business Standard, the study also found that 80% of those making more than 500 trades a year lost money.
What percentage of crypto traders lose money?
An estimated 73-81% of retail crypto app users had likely lost money on their initial bitcoin investment by the end of 2022, according to BIS Working Paper 1049. That is a modelled estimate, not an account count. The researchers used app download and usage data from 95 economies, assumed users bought bitcoin when they first downloaded an exchange app, and valued the position at the end-2022 price, near a market low. A different date would give a very different figure.
A companion BIS Bulletin (February 2023) says only that a majority of crypto app users in nearly all economies made losses on their bitcoin holdings, and that large holders sold while smaller retail investors bought around the Terra/Luna and FTX collapses. The 73-81% belongs to the working paper, not the bulletin.
Do most prediction market traders lose money?
Most appear to, and the profits are highly concentrated. Using the full Polymarket trade history, Akey, Gregoire, Harvie and Martineau (CEPR Discussion Paper, June 2026) found that the top 1% of users with positive profits captured 76.5% of all profits. The winners provided liquidity with limit orders; the losers took liquidity with market orders. Press coverage of the paper reports that about 69% of users lost money, 1,704,601 of 2,469,589, as reported by Gigazine. That figure is not in the paper’s abstract.
The Wall Street Journal’s own analysis, as reported by Benzinga, found that 0.1% of Polymarket accounts took 67% of all profits and more than 70% of users were in the red, most of them by small amounts.
Do leveraged ETF traders lose money?
Nobody can give an honest percentage yet, because we found no account-level study of leveraged ETF traders. The figures that exist are aggregate losses, and all of them are second-hand:
- South Korea’s Financial Supervisory Service found individual investors lost an average of KRW 449 billion a year on overseas derivatives from 2022 to October 2025, as reported by Kyunghyang Shinmun. Since 15 December 2025, Korean investors must complete pre-education and mock trading before buying overseas derivatives or leveraged ETPs.
A widely shared US figure attributed to ETF Action could not be found in any ETF Action publication, so it is not used here.
Do long-term investors lose money too?
Mostly not in absolute terms. The research measures a shortfall, the gap between what funds returned and what their investors earned by buying and selling at the wrong times, and its size depends on who is measuring.
- Morningstar’s Mind the Gap 2026 study reports that US fund investors earned 8.7% a year over the 10 years to December 2025, against 9.9% for their funds, a gap of 1.2 percentage points. The gap was 0.4 points in the least volatile funds and more than 2.0 points in the most volatile. Morningstar’s page blocked our reader, so these figures are as reported by Advisor Analyst.
- A Financial Analysts Journal paper by Fulkerson, Jordan, Riley and Yan (May 2026) re-analysed the data behind Morningstar’s 2025 edition and put the cost of bad timing at about 0.10% a year, not 1.2%.
- DALBAR’s 2026 report says the average US equity fund investor returned 17.16% in 2025, against 17.88% for the S&P 500, a gap of 0.72 percentage points. Critics including Wade Pfau argue the method overstates the gap, because it compares a lump-sum index return with an investor return built from ongoing contributions.
What percentage of Australian traders lose money?
68.42% of retail CFD clients of Australian-licensed issuers realised a net loss in FY2024, after fees, according to ASIC’s REP 828, published in January 2026. For options CFDs, 84.65% of retail clients lost money. The caveat: these are clients of Australian-licensed issuers, and before 2021 most were not Australian. ASIC’s REP 626 found 83% of issuers’ clients were offshore in 2019, so the older figures below describe the industry’s clients, not Australians.
The 2017 review. Using data from 57 licensed issuers, ASIC found that over 12 months, 72% of clients who traded CFDs lost money, along with 63% of margin FX clients and 80% of binary options clients (REP 579, restated in REP 626).
Binary options. ASIC’s 2017 and 2019 reviews both found about 80% of retail clients lost money. Retail net losses were around A$490 million in 2018, a figure that includes offshore clients; Australian retail clients lost more than A$6.7 million in 2019. ASIC banned their sale to retail clients from 3 May 2021 and later extended the ban to 2031.
COVID-19. In a staff paper on the February to April 2020 sell-off, ASIC calculated that if all retail investors had held their positions for only one day, losses would have exceeded A$230 million; that is ASIC’s hypothetical, not realised losses. Across five volatile weeks from 16 March to 19 April 2020, the share of retail CFD accounts losing money each week ranged from 56.9% to 63.2%, and retail clients of 13 issuers made net losses of A$774 million (ASIC public notice, paras 14-17).
Leverage caps. ASIC capped retail CFD leverage from 29 March 2021. In the first quarter, loss-making retail accounts fell to 50% of active accounts from a quarterly average of 64% in the previous year, and retail net losses fell from a quarterly average of A$372 million to A$22 million (ASIC CP 348). Part of that came from a changed population: active retail accounts fell 29%, partly because there were fewer offshore clients. Wholesale clients, who are not covered by the caps, stayed at 63% loss-making.
FY2024 (REP 828). The most detailed Australian data so far comes from ASIC’s review of 52 CFD issuers, using client data from 50 licensees for 1 July 2023 to 30 June 2024. It counts realised losses only:
- 68.42% of retail CFD clients (133,674 of 195,386) realised a net loss, totalling A$458 million including A$73 million in fees. 29.27% (57,183) made a net profit of A$172 million after A$26 million in fees. (The report’s text elsewhere says 32% made money; these figures are from its Table 2.)
- 84.65% of retail clients trading options CFDs lost money, as did 70.25% of wholesale clients, who lost A$738 million.
- 5% of retail clients would have made a profit but lost money because of fees.
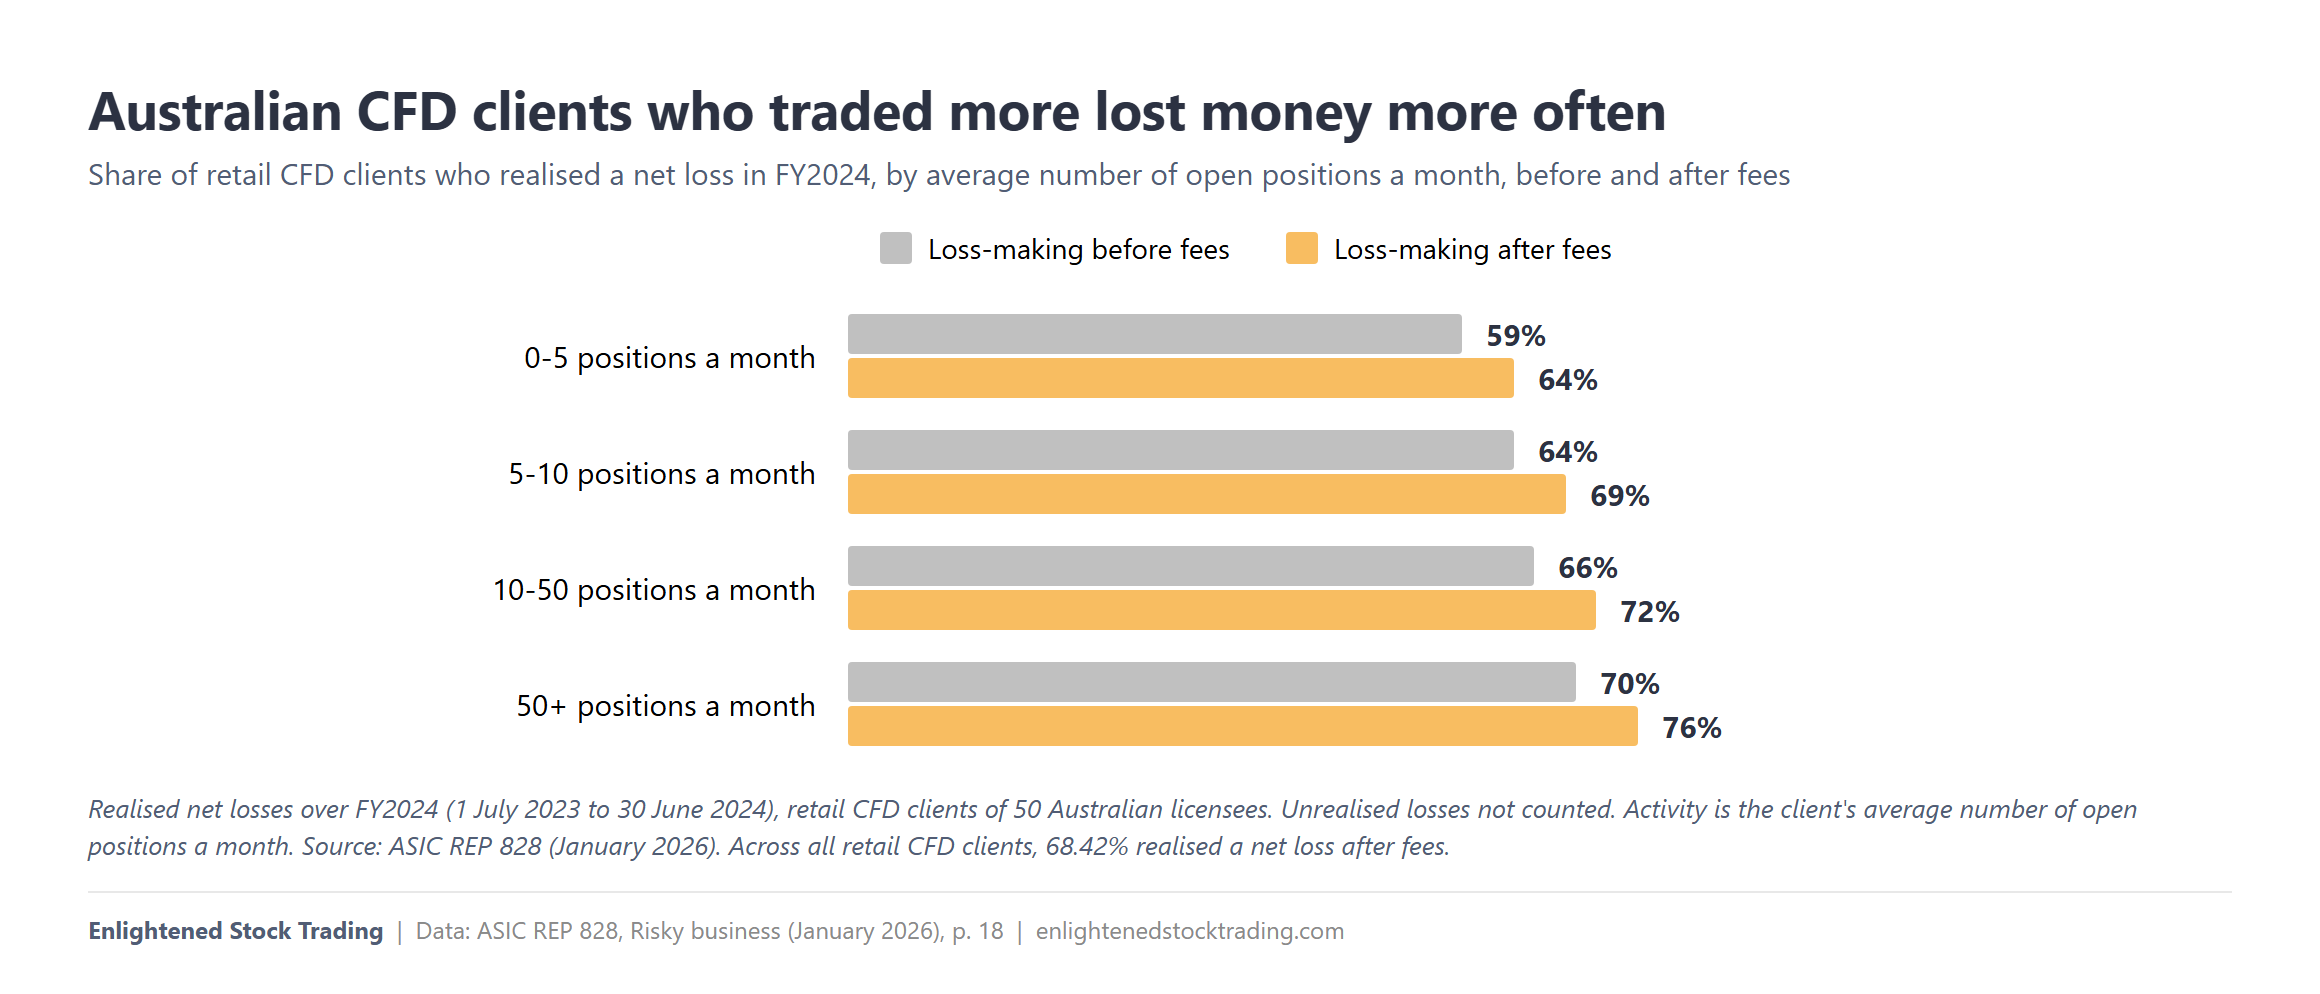
- Loss rates rose with activity: 64% of clients averaging 0-5 open positions a month lost money after fees, rising to 76% for those averaging 50 or more. ASIC’s own conclusion was that the more clients trade, the more they lose, especially after fees.
- 67% of new retail clients who first traded in the first quarter of FY2024 had stopped trading by year end, and 74% of new retail clients acquired through paid online advertising lost money.
No loss warning in Australia. UK and EU brokers must tell you what percentage of their clients lose money; Australian CFD providers do not. ASIC proposed a provider-specific loss-percentage warning in CP 322 and then left it out of its October 2020 product intervention order (ASIC public notice, paras 64 and 66(e)). Its stated reasons: the order’s other measures were expected to reduce the harm, research shows warnings often work less well than expected, and the implementation costs were not justified. When we checked IG Australia’s site on 2 October 2026, it showed no percentage. The order expires on 23 May 2027 unless ASIC remakes it (REP 828, Table 1), so expect new Australian data in 2026-27.
What else ASIC has flagged. In August 2026, after reviewing nine online brokers, ASIC warned retail investors about short-dated exchange-traded options and futures, and about sign-up incentives such as commission-free trading and airline points. The release contains no loss statistics. Activity is rising too: CommSec reported 11.5% more active customers and 27% higher trading volumes in FY2026, as reported in a MarketScreener reproduction of the release.
So for CFDs, the best current Australian answer is 68.42% of retail clients over a year, counting realised losses after fees. For Australian share traders, we found no published outcome figure at all.
Which trading statistics should you stop quoting?
Seven numbers circulate on trading sites and in AI answers. Here is where each traces to.
“95% of traders fail”
We found no study behind it. It circulates on forums and broker blogs without a source. Verdict: unsourced. If you need a real number that high, use SEBI’s: 93% of Indian F&O traders lost money over FY2022 to FY2024.
What is the 90-90-90 rule in trading?
The rule says 90% of new traders lose 90% of their money within 90 days. It is trading folklore with no study behind it. Verdict: unsourced. The nearest real figure is about quitting, not losing: ASIC found 67% of new retail CFD clients who first traded in the first quarter of FY2024 had stopped by the end of the year. US forex disclosures do use roughly 90-day windows, but they report the share of accounts that were profitable, not how much capital was lost.
“Only 1% of day traders make money”
This distorts the Taiwan research. Barber, Lee, Liu and Odean found fewer than 1% of day traders were predictably profitable year after year, while about 13-15% were profitable after fees in any given year. It also gets mixed up with Brazil, where the February 2020 version of the paper reports 0.4% earning more than a bank teller, and earlier versions report 1.1% earning more than the minimum wage, according to CXO Advisory. Verdict: distortion.
“The average day trader success rate is 4% (or 4.5%)”
The 4% traces to practitioner estimates drawn from prop-firm experience, such as those by Steve Burns of New Trader U and Cory Mitchell, not to a study of trader accounts. We could not find any origin for 4.5%, or for the related “3.5% to 4.5%” range. Verdict: anecdote, not a statistic.
“Longer-term traders have a 20% chance of success”
We found no source. It may be a garbled version of Jordan and Diltz, where 19.4% of 324 US day traders in 1998-99 made more than US$5,000. Verdict: unsourced, possibly a distortion.
“97% of traders lose money”
The number is real, but it needs its population. In Brazil, 97% of people who day traded futures on more than 300 days lost money (Chague et al.). In Taiwan, researchers estimated that 97% of day traders were likely to lose money in future day trading (Barber et al. 2020). Neither is a figure for all traders. Verdict: fine with qualifiers.
“Investors underperform by X% a year (DALBAR)”
DALBAR’s figures are quoted everywhere, usually without the dispute over its method. Verdict: contested. Prefer Morningstar’s dollar-weighted gap, and mention the Financial Analysts Journal critique that puts the cost of bad timing far lower.
What do the traders who don’t lose have in common?
In these studies, the minority who did better traded less, paid less in costs and used less leverage, and in two markets they used a different trade structure. Experience on its own did not help.
- They traded less. The least active US households earned 18.5% a year after costs, against 11.4% for the most active (Barber and Odean). Australian CFD loss rates rose from 64% at 0-5 open positions a month to 76% at 50 or more (REP 828).
- They paid less in costs. About 4.4 lakh Indian F&O traders were profitable before costs and not after them in FY2026 (SEBI 2026), and 5% of Australian retail CFD clients lost money only because of fees (REP 828).
- They used less leverage. After ASIC capped leverage, loss-making retail CFD accounts fell from 64% to 50% in the first quarter (CP 348). Leverage also runs through the professional blow-ups in our Hedge Fund Graveyard.
- Experience alone did not help. New and returning Indian F&O traders lost at almost the same rate in FY2026, 87.81% against 87.69% (SEBI 2026), and the French, Taiwanese futures and Brazilian studies found no learning effect.
- Bigger portfolios lost less often. The share of Indian F&O traders losing money fell from 93% for those with equity holdings under INR 50,000, or none, to 58% for those holding more than INR 10 crore (SEBI 2026).
- Structure mattered. Successful Polymarket traders provided liquidity with limit orders while losers took it with market orders (Akey et al.), and multi-leg 0DTE trades did significantly better than single-leg trades (Beckmeyer et al.).
- The best persisted, but they were rare. Taiwan’s 500 best day traders in one year earned positive returns after fees the next year, yet fewer than 1% of day traders were predictably profitable (Barber et al. 2014).
What does a rules-based process change?
It moves most of those variables to before the trade. It does not come with a success rate: none of these studies measured rules-based traders as a group, so I cannot tell you what percentage of systematic traders make money, and I have not seen anyone who can provide that data. What I can say is that anecdotally after speaking with many hundreds of traders over the last 10 years, far more systematic traders seem to be consistent and profitable compared to discretionary traders. What a written, tested process does is decide these things in advance:
- How often you trade. The entry rules set the frequency, and the backtest shows roughly how many trades a year to expect before any money is at risk.
- Position size and leverage. A position sizing formula and a fixed leverage limit replace the size you feel like taking on the day. The risk of ruin calculator shows what your own size does to the odds of an unrecoverable loss.
- Costs. A proper backtest includes commissions and slippage, so an idea that only works before costs is rejected in testing instead of in your account. A real trading edge has to survive costs, and the backtest is where you find out whether yours does.
- When you stop. Losing Taiwanese day traders kept trading at almost the same rate as winners. A written process states in advance what result would make you stop trading a system.
This next part is my view, not something the studies measured. In more than 25 years of trading and working with thousands of traders, the failure I see most often is the trader with no tested rules who abandons their plan in the first drawdown, because nothing told them that drawdown was normal. Close behind are cutting winners short while letting losers run, using more leverage than they can sit through, and expectations set by somebody else’s best month. A tested process makes each of those decisions in advance, when nothing is at stake.
Which of these habits do you have?
The studies describe what the losing majority do: they trade too often, pay too much in costs, use too much leverage and keep going without improving. They cannot tell you which of those habits are yours.
The free Trading Skills Quiz can. It takes you through nine areas of trading skill and shows you your weakest gap, so you know what to fix first instead of guessing.
If the quiz shows gaps you want help closing, the Trader Success System is how I teach traders to build, test and run rules-based systems.
Remember – you are only one trading system away.
How was this ledger compiled?
Every number on this page was read in its primary source wherever we could access one, and is labelled where we could not.
What is included. Account-level, exchange or regulator data on retail trading outcomes, plus mandatory broker disclosures, where a primary source is publicly available. Modelled estimates (BIS), return-gap studies (Morningstar, DALBAR) and aggregate-dollar studies (options) are included because they are widely quoted, each labelled for what it measures. Behaviour surveys and self-reported industry figures, such as prop-firm pass rates, are in the CSV but not used as headline numbers.
Three verification levels.
- Verified primary: we read the number in the paper, the official abstract, the regulator report or the broker’s own page.
- Secondary only: the primary was paywalled, blocked or not public, so the number comes from credible secondary coverage and is labelled “as reported by”, with a link.
- Unverified: we could not find the number in any credible source. Unverified numbers are not used on this page.
Last verified: 2 October 2026. Broker loss disclosures are recalculated every quarter, so check the provider’s own page for the current number. Where versions of a paper differ, the version is named.
Currency and dates. ASIC figures are in Australian dollars. SEBI figures are in Indian rupees (1 lakh is 100,000; 1 crore is 10 million). Indian financial years run April to March and Australian financial years July to June.
Download the data. The full ledger, with the population, definition of losing, period, primary source and verification status of every entry, is a free CSV: download the Trader Outcomes Ledger (CSV). No email required.
Corrections. If you find an error or a missing study, let us know and we will check it against the primary source.
How should you cite this page?
Reid, A. (2026). What Percentage of Traders Lose Money? Every Study, Sourced (The Trader Outcomes Ledger). Enlightened Stock Trading. https://enlightenedstocktrading.com/what-percentage-of-traders-lose-money/ (last verified 2 October 2026).
If you quote a single figure, please also cite the primary source linked beside it, with its population and period.
Frequently asked questions
Is it true that 90% of traders lose money?
In some markets it is close: 87.7% of Indian equity F&O traders lost money in FY2026, and 93% over FY2022 to FY2024 (SEBI). It was 82% for UK CFD clients (FCA, 2016) and 68.42% for Australian retail CFD clients in FY2024 (ASIC). No study supports 90% as one figure for all traders.
Do 97% of day traders lose money?
Only in specific groups. 97% of Brazilians who day traded futures on more than 300 days lost money, and researchers estimated that 97% of Taiwanese day traders were likely to lose money in future day trading. Neither figure covers all day traders.
What percent of day traders are successful?
It depends on the definition. 35.8% of 324 US day traders were profitable after commissions in 1998-99. In Taiwan, about 13-15% were profitable after fees in a typical year and fewer than 1% predictably. In Brazil’s persistent group, only 0.4% earned more than a bank teller.
What percentage of traders are profitable?
Where studies report it directly: 35.8% of US day traders in 1998-99, about 13-15% of Taiwanese day traders in a typical year, 29.27% of Australian retail CFD clients in FY2024, and 34.5% of one US forex dealer’s accounts in the quarter to June 2026.
Is forex trading profitable?
For most retail clients, no. Regulators found that 63% (Australia, margin FX, 2017 review), 82% (UK, 2016) and 89% (France, 2009 to 2012) of clients lost money. On 2 October 2026, UK broker disclosures showed 68% to 72.9% of retail accounts losing money over 12 months.
What percentage of options traders are profitable?
No study has published that percentage. US research measures aggregate losses instead: about US$2.1 billion from November 2019 to June 2021, and more than US$125 million on 0DTE S&P 500 options from February 2021 to September 2023. A Cboe-funded 2025 paper disputes the first result.
What is the 90-90-90 rule in trading?
It claims 90% of new traders lose 90% of their capital within 90 days. No study supports it. The closest real figure: 67% of new Australian retail CFD clients who started in the first quarter of FY2024 had stopped trading by year end (ASIC REP 828).
Why do most traders lose money?
The studies point to costs, trading too often, leverage and no improvement with experience. Costs turned about 4.4 lakh profitable Indian F&O traders into net losers in FY2026, and Australian CFD loss rates rose from 64% to 76% as activity increased.
Sources
Primary sources are linked beside every figure above; this list collects them in one place. Entries marked (secondary) are figures we could not read in the primary source.
Academic research
- Chague, F., De-Losso, R. and Giovannetti, B. (2019, rev. 2020). Day Trading for a Living? FGV EESP Working Paper 525; SSRN 3423101. RePEc abstract
- Chague, F. and Giovannetti, B. (2025). As pandemias de COVID-19 e de day trade no Brasil. FGV EESP. PDF
- Barber, B., Lee, Y.-T., Liu, Y.-J. and Odean, T. (2014). The cross-section of speculator skill. Journal of Financial Markets 18, 1-24. Abstract · Working paper
- Barber, B., Lee, Y.-T., Liu, Y.-J., Odean, T. and Zhang, K. (2020). Learning, Fast or Slow. Review of Asset Pricing Studies 10(1), 61-93. Abstract · 2017 working paper
- Kuo, W.-Y. and Lin, T.-C. (2013). Overconfident individual day traders. Journal of Banking and Finance 37(9), 3548-3561. Abstract
- Barber, B. and Odean, T. (2000). Trading Is Hazardous to Your Wealth. Journal of Finance 55(2), 773-806. PDF
- Jordan, D. and Diltz, J. D. (2003). The Profitability of Day Traders. Financial Analysts Journal 59(6), 85-94. Abstract
- Bryzgalova, S., Pavlova, A. and Sikorskaya, T. (2023). Retail Trading in Options and the Rise of the Big Three Wholesalers. Journal of Finance 78(6), 3465-3514. LBS repository
- Beckmeyer, H., Branger, N. and Gayda, L. (2023). Retail Traders Love 0DTE Options… But Should They? Working paper, December 2023 version. PDF
- Amaya, D., Garcia-Ares, P., Pearson, N. and Vasquez, A. (2025). New Evidence on the Performance of Customer Options Trades. Working paper, Cboe Options Institute data grant. PDF
- Auer, R., Cornelli, G., Doerr, S., Frost, J. and Gambacorta, L. (2022). BIS Working Paper No. 1049. BIS
- Cornelli, G., Doerr, S., Frost, J. and Gambacorta, L. (2023). BIS Bulletin No. 69. BIS
- Akey, P., Gregoire, V., Harvie, N. and Martineau, C. (2026). Who Wins and Who Loses in Prediction Markets? CEPR Discussion Paper 21615. Abstract
- Fulkerson, J., Jordan, B., Riley, T. B. and Yan, Q. (2026). Bad Timing Does Not Cost Investors 15% of Their Funds’ Returns. Financial Analysts Journal. CFA Institute
Regulators
- ASIC REP 579, Improving practices in the retail OTC derivatives sector (June 2018). PDF
- ASIC REP 626, Consumer harm from OTC binary options and CFDs (August 2019). PDF
- ASIC staff paper, Retail investor trading during COVID-19 volatility (May 2020). PDF
- ASIC public notice, CFD product intervention order (October 2020). PDF
- ASIC media release 21-064MR, binary options ban (2021). ASIC · 22-243MR, ban extended to 2031. ASIC
- ASIC CP 348 (October 2021). PDF
- ASIC REP 828, Risky business: Driving change in CFD issuers’ distribution practices (January 2026). PDF
- ASIC media release 26-193MR (August 2026). ASIC
- ESMA, CFD and binary options intervention (March 2018). ESMA
- FCA CP16/40 (December 2016). PDF · FCA PS19/18 (July 2019). PDF
- AMF, Lettre de l’Observatoire de l’epargne No. 10 (October 2014). PDF
- SEBI, FY2025-FY2026 equity derivatives study (August 2026). PDF · FY2022-FY2024 study (September 2024). SEBI · Intraday cash study (July 2024). SEBI · Risk disclosure circular (May 2023, exchange-hosted copy). PDF
- CFTC retail forex rules (2010). CFTC
Broker disclosures and industry data (read 2 October 2026)
- IG UK · IG Germany · IG Australia · CMC Markets UK · Pepperstone UK · tastyfx
- DALBAR, QAIB 2026 release (April 2026). DALBAR
- Morningstar, Mind the Gap 2026 (August 2026). Morningstar
Secondary coverage cited
- CXO Advisory on Chague et al. Link · Business Standard on SEBI’s intraday study. Link · Gigazine on Akey et al. Link · Benzinga on the WSJ Polymarket analysis. Link · Kyunghyang Shinmun on the FSS figures. Link · Advisor Analyst on Mind the Gap 2026. Link · Advisor Perspectives, Wade Pfau on DALBAR. Link · MarketScreener reproduction of the CommSec FY2026 release. Link