A 16-year backtest of a same-day ETF short strategy – and three lessons about stops, order types and leverage that apply to any system you build.
Here is a confession most system developers will recognise.
I built a short-selling system with a sensible stop loss. It looked solid in testing. Then I ran it on data it had never seen, and it fell apart: a 30% win rate and a losing average trade.
The fix was surprisingly simple. I removed the stop altogether.
That sounds reckless, and in most systems it would be. But in this one, the stop was cutting every trade at the exact moment the trade was designed to sit through. Take it away and the same rules survived six and a half years of fresh data.
This article walks through that system – I call it Stretch Fade – and what it taught me. You will see how it works, why it works, where it fails, and why a short system that looks almost boring on its own can earn a place in a portfolio.
This is not a recommendation to trade. Stretch Fade is an example system, shared to show how a mean reversion idea is tested and to give you ideas for your own research. It is currently in incubation, which means I am watching it trade on paper before deciding anything. Please treat it the same way.
What Is a Mean Reversion Trading Strategy?
A mean reversion trading strategy bets that a price which has moved too far, too fast will snap back toward normal.
Most traders meet this idea as “buy the dip”. A stock drops sharply, fear peaks, and the system buys on the expectation of a bounce.
Stretch Fade flips that around. It looks for the opposite extreme: an ETF that is already in a downtrend, suddenly rips higher for several days, and then gaps up again at the open. Often that rally is just a move into resistance, fuelled by short covering and late buyers, and the opening gap is frequently the last burst of energy.
The system shorts that open and covers at the close the same day. It never holds a position overnight.
How Does the Stretch Fade Strategy Work?
There are four moving parts. I will describe what each one does. The exact settings are in the full rules and code (more on that below).
1. It measures the rally against the ETF’s own volatility.
A 5% move in a utilities ETF is enormous. A 5% move in a 3x leveraged semiconductor ETF happens before lunch. So instead of using a fixed percentage, the system measures the recent rally in standard deviations of that ETF’s own daily moves. Only a rally that is extreme for that particular ETF qualifies.
This one idea, normalising by volatility, is worth stealing for almost any system you build. It lets one set of rules work across very different instruments.
2. It only fades rallies inside a downtrend.
A long-term moving average acts as a trend filter. The ETF must be below it. Fading a strong rally in an uptrend is how short sellers get run over. Fading a rally in a downtrend is fading the counter-trend move.
3. It stands aside when the broad market is in a steady bull run.
A simple regime filter on the S&P 500 switches the system off when the index is trending up cleanly. Those are the markets where rallies keep going. More on what this costs and buys you later.
4. It only shorts if the open gaps even higher.
This is the most important rule, and I will come back to it. The order is a limit-on-open placed the night before, a little above the previous close. If the ETF opens at or above that price, the short fills. If it opens below, there is no trade.
Exit is a market-on-close order the same day. No profit target, no time stop, no stop loss.
The universe is 53 liquid US ETFs: around 30 plain index, sector, bond and commodity ETFs, plus 23 leveraged and inverse ETFs.
Want the exact rules? The full Stretch Fade rules, every parameter value and the complete RealTest code are free.
Get the Free Stretch Fade Code Here
The Surprise: A Short System That Mostly Buys Dips
When I broke the 330 trades down by instrument, one result stood out.
188 of the 330 trades were shorts on inverse ETFs – funds like SQQQ, SPXS and SOXS that rise when the market falls.
Think about what that means. An inverse ETF rallies hard for five days when its underlying index is falling hard. Shorting the inverse ETF is, in effect, buying the underlying index after a sharp drop – a classic buy-the-dip trade wearing a short-selling costume.
Those inverse trades were also the best ones: an average gain of +1.36% per trade with a 61.7% win rate, compared with +0.43% and 52.8% for everything else.
The split by leverage was even starker:
| ETF group | Trades | Average trade |
|---|---|---|
| Leveraged and inverse ETFs | 231 | +1.35% |
| Plain (unleveraged) ETFs | 99 | +0.05% |
Almost all of the edge lives in the leveraged ETFs. That makes sense. Daily compounding exaggerates multi-day moves in a 3x fund, so a stretch in the leveraged ETF is more extreme than the same move in its parent index – and it snaps back harder.
This is why I always break results down by instrument before trusting them. The headline number told me “short system”. The trade list told me something far more interesting.
Why Did Removing the Stop Loss Save This Strategy?
Stretch Fade began life with a 5% stop loss, because that is what sensible traders do. In sample, it worked. Out of sample, it failed badly:
| Version | Out-of-sample win rate | Out-of-sample average trade | Out-of-sample profit factor |
|---|---|---|---|
| With a 5% stop | 30.0% | -0.26% | 0.68 |
| No stop | 51.7% | +0.62% | 1.48 |
(Profit factor is gross profit divided by gross loss. Below 1.0, the system loses money.)
Same entries. Same exits. The only difference was the stop.
Here is why. This trade shorts an ETF that has just gapped up at the open after a big run. The first hour after a gap like that is chaotic. Price often spikes higher before it turns. A stop loss sits right in the path of that spike, so it takes you out at the worst price of the day, and then you watch the trade come back without you.
In other words, the stop was locking in the loss from the normal noise that many winning trades experienced right after the entry.
So I tried the obvious repair: a smarter stop scaled to each ETF’s volatility. In sample, it looked brilliant: MAR (annual return divided by maximum drawdown) jumped from 0.54 to 0.89. Out of sample it was worse on almost every measure: MAR 0.40 against 0.43, an average trade of +0.38% against +0.62%, and a profit factor of 1.32 against 1.48.
That is one of the most useful lessons in this whole project. A change that improves in-sample results this much and then fails on new data is a huge warning sign.
None of this means stop losses are bad. In most trend following and swing systems they are essential. The point is narrower and more practical: a stop must fit the thesis of the trade. In a same-day fade, the risk control has to live somewhere else. In Stretch Fade, it lives in the setup:
- The downtrend filter keeps it out of strong uptrends. Removing that one rule took the in-sample drawdown from -4.90% to -16.66%.
- The regime filter keeps it out of steady bull markets.
- The same-day exit means no overnight gap risk.
- Position sizing caps each trade at 10% of the account.
Why Is the Limit-on-Open Order the Real Edge?
If you remember one rule from this system, make it this one.
I tested Stretch Fade without the limit price, simply shorting every qualifying ETF at the open regardless of where it opened. The result was 1,957 trades and a profit factor of 0.98. A losing system.
Add the limit back and the profit factor rises to 2.35 in sample on 181 trades.
The limit-on-open is doing two jobs at once:
- It confirms the exhaustion. The ETF has to gap up further on the day you short it. Only the most overextended moves get through.
- It gives you a better price. You are always shorting above the prior close, never chasing a weak open.
This is a lesson about order types that many traders miss. The same signal, executed with a different order, can be the difference between an edge and no edge at all. When you test your own systems, test the order type as carefully as the entry signal.
Did This Mean Reversion Strategy Hold Up Out of Sample?
I developed the system on 2010 to 2019 data, then tested it on January 2020 to August 2026. Here are the results, including commissions and slippage:
| Full period (2010-2026) | In-sample (2010-2019) | Out-of-sample (2020-2026) | |
|---|---|---|---|
| Annual return (RealTest) | 2.12% | 2.65% | 2.21% |
| Maximum drawdown | -5.14% | -4.90% | -5.14% |
| MAR | 0.41 | 0.54 | 0.43 |
| Trades | 330 | 181 | 149 |
| Win rate | 57.9% | 63.0% | 51.7% |
| Average trade | +0.96% | +1.24% | +0.62% |
| Profit factor | 1.85 | 2.35 | 1.48 |
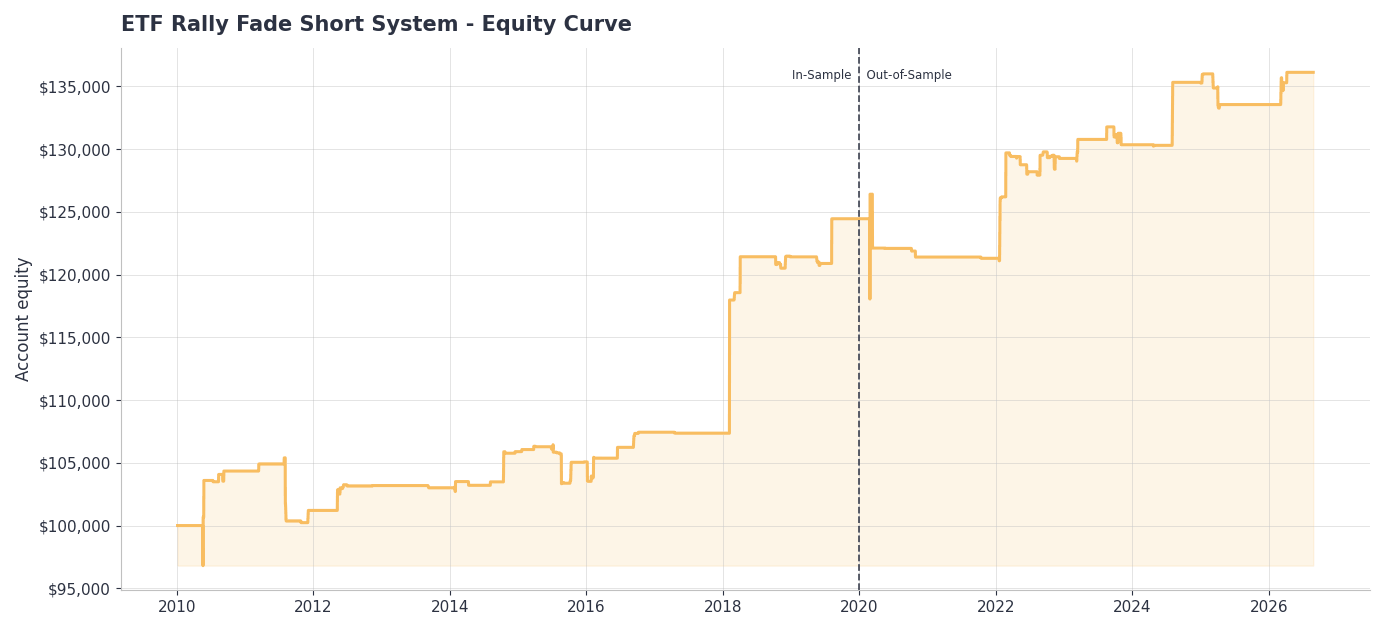
$100,000 grew to $136,115 from January 2010 to August 2026. The dashed line marks the start of the out-of-sample test in 2020.
The headline held up on the out-of-sample years. The worst drawdown barely moved (-5.14% against -4.90%) and MAR kept 80% of its in-sample value (0.43 against 0.54).
But I have to be straight with you about two things.
First, the quality of the edge changed. The average trade halved and the win rate fell from 63% to 52%. Out of sample, the system leaned on a handful of big winners rather than a steady stream of small ones.
Second, this out-of-sample period is not perfectly clean. I had already seen how the no-stop version behaved on 2020-2026 while diagnosing the stopped version. That makes this result a confirmation of what I had already seen. Which is exactly why Stretch Fade is in incubation now: live data is the only truly unseen test left.
And yes, a 2.12% annual return is small. On its own, this system will not grow an account. Keep reading to see why it can still be useful.
When Does It Make Money – and When Does It Hurt?
The yearly returns tell the real story:
| Year | Stretch Fade | SPY buy and hold |
|---|---|---|
| 2010 | +4.35% | +13.06% |
| 2011 | -3.01% | +1.83% |
| 2012 | +1.96% | +15.46% |
| 2013 | -0.17% | +30.53% |
| 2014 | +2.80% | +12.65% |
| 2015 | -0.77% | +1.15% |
| 2016 | +2.25% | +10.89% |
| 2017 | -0.07% | +19.53% |
| 2018 | +13.09% | -4.02% |
| 2019 | +2.50% | +27.43% |
| 2020 | -2.46% | +16.02% |
| 2021 | -0.08% | +25.55% |
| 2022 | +6.56% | -16.43% |
| 2023 | +0.84% | +22.69% |
| 2024 | +3.81% | +21.90% |
| 2025 | -1.31% | +15.72% |
| 2026 (to 27 Aug) | +1.92% | +12.24% |
Two patterns jump out.
It earns in grinding, choppy bear markets. 2018 and 2022 were the two years SPY lost money, and they were Stretch Fade’s two best years. Those are markets full of sharp relief rallies that fail, which is exactly what the system fades. Its single best trade came on 24 February 2022, the day Russia invaded Ukraine: the market opened sharply lower, the inverse semiconductor ETF SOXS gapped up, and then the market reversed hard. The short on SOXS made +19.7% in one session.
It gets hurt in waterfall crashes. August 2011, March 2020 and April 2025 produced most of the worst trades. In a true panic, the selling does not reverse by the close. Shorting an inverse ETF on those days is buying a dip that keeps dipping, and with no stop the full loss lands. The worst trade in the backtest was -15.3%, on 4 August 2011.
In steady bull markets, such as 2013, 2017 and 2021, it barely trades at all. That is the regime filter doing its job. It also means long, quiet stretches where nothing happens. If you ever trade a system like this, expect flat years. They are normal for this type of strategy.
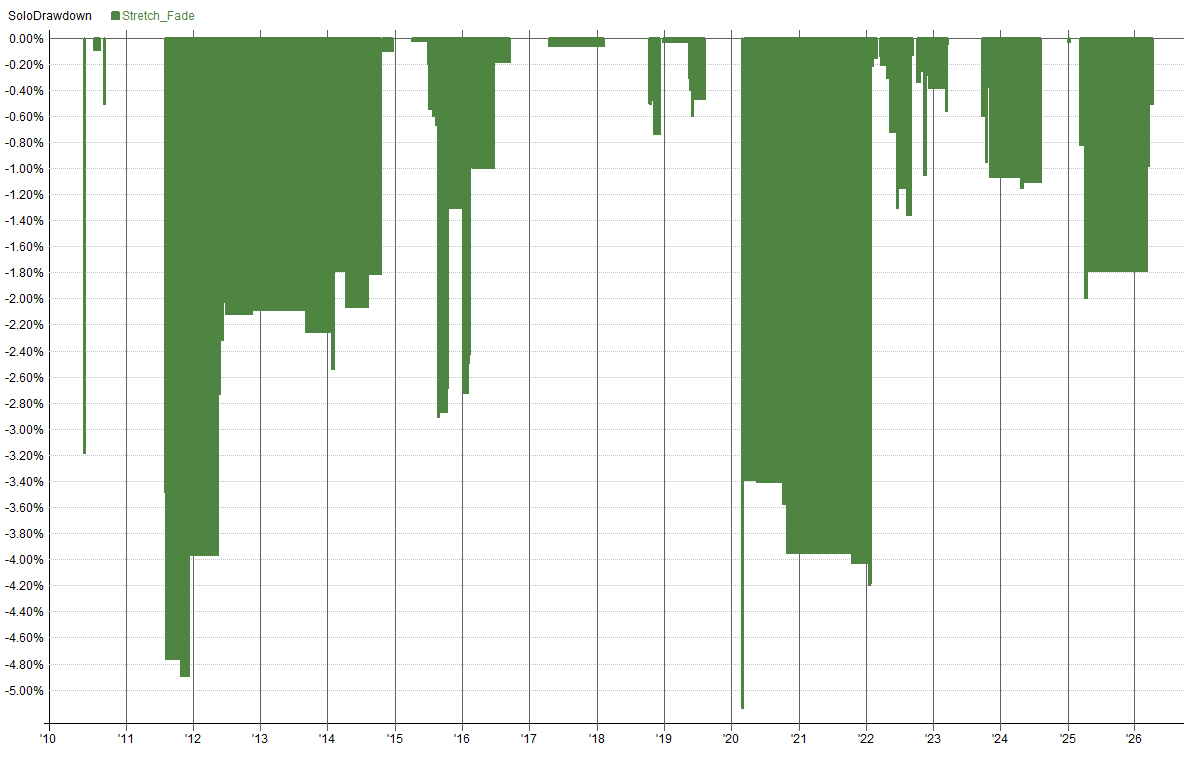
Drawdown, 4 Jan 2010 – 27 Aug 2026.
Where Could a Short Mean Reversion Strategy Fit in a Portfolio?
Look at that yearly table again. Most systematic traders run long-biased systems, and long-biased systems have their worst years in markets like 2018 and 2022.
That is where a small allocation of capital to a short strategy like Stretch Fade can earn its keep in a portfolio. Over the full test, its daily returns had a correlation of just 0.10 with SPY. It is in the market for one session at a time, so it never carries overnight exposure.
To see what that does in practice, I combined it with a buy-and-hold position in the Nasdaq 100, with each holding its own share of the capital, rebalanced monthly (May 2010 to August 2026):
| Nasdaq 100 alone | 80% Nasdaq 100 / 20% Stretch Fade | 50% / 50% | |
|---|---|---|---|
| Annual return | 18.5% | 15.3% | 10.4% |
| Maximum drawdown | -35.6% | -28.2% | -16.2% |
| MAR | 0.52 | 0.54 | 0.64 |
Adding Stretch Fade costs return, because it earns so little on its own. What it buys is a much smaller drawdown for each unit of return. The 50/50 mix cut the worst drawdown by more than half while keeping a double-digit annual return.
That is the role of a diversifying system. It makes the whole portfolio easier to live with. Whether that trade-off suits you depends on your own goals.
How Could This System Fail?
Every system can fail. These are the ways this one most likely would:
- A low standalone return. At 2.12% a year, it only makes sense as one part of a portfolio.
- No stop loss. A short that gaps up and keeps running all day is held to the close. The filters reduce how often that happens, but they do not cap the loss on any one day.
- Waterfall crashes. As 2011, 2020 and 2025 showed, sudden panics are its worst environment.
- Fewer, bigger winners. If the occasional outsized day stops coming, out-of-sample returns would shrink toward breakeven.
- Borrowing leveraged ETFs. Shorting 3x ETFs depends on your broker having shares available to borrow. The backtest assumes every order fills.
- Execution discipline. Shorting at the open without the limit, or holding past the close, is a different, losing system.
- A contaminated out-of-sample period. As explained above, live data is the real test.
Five Ideas to Take Stretch Fade Further
I would certainly not recommend anyone trade this system in its current state, but it can no doubt be improved. This is where an example system becomes useful: as a starting point for your own research. Here are the ideas that came out of my testing:
- Trade only the best regime. One market condition – an index above its long-term average but below its short-term one – produced trades of much higher quality. Could a system that trades only that regime rebuild its trade count with a wider universe?
- Use -1x inverse ETFs instead of 3x. The same logic worked on unleveraged inverse ETFs, with a similar win rate and profit factor at about 40% of the per-trade size, in funds that are far easier to borrow.
- Hold overnight, but only where borrowing is cheap. A one-day hold improved results, but was rejected because of borrow and gap risk on 3x ETFs. On -1x inverse ETFs, that objection mostly disappears.
- Replace the trend filter with volatility sizing. Removing the downtrend filter nearly doubled the trade count but blew out the drawdown. Sizing each position by its volatility might keep the trades and control the risk.
- Flip the failure into a system. The worst losses cluster on a handful of panic days. Is there a separate edge in going with those days instead of against them?
None of these has been tested yet. That is the fun part.
Get the Full Stretch Fade Rules and RealTest Code
This article shows you how Stretch Fade works and why. If you want to study it properly, run it yourself and start testing these ideas, the complete package is free:
- Every rule, with the exact parameter values
- The universe of 53 ETFs and how the two tiers are handled
- Position sizing and cost assumptions
- The full RealTest code, ready to run with Norgate data
Get the Free Stretch Fade Code Here
And if you want to learn to build and test systems like this yourself – with in-sample development, out-of-sample testing and the discipline to reject your own ideas – that is exactly what we teach in the Trader Success System.
Remember – you are only one trading system away!
Frequently Asked Questions
What is a mean reversion trading strategy?
A mean reversion trading strategy bets that a price which has moved unusually far in a short time will move back toward its normal level. Most are long “buy the dip” systems. Stretch Fade is the short version: it fades extreme rallies in ETFs that are in a downtrend.
Should a mean reversion strategy use a stop loss?
It depends on the trade. In this same-day short system, a fixed 5% stop turned a profitable strategy into a losing one out of sample, and a volatility-based stop also did worse on new data. Because the trade is designed to sit through intraday noise, the risk is controlled through trend and regime filters, a same-day exit and position size instead.
Why short leveraged and inverse ETFs?
Daily compounding exaggerates multi-day moves in leveraged ETFs, so their stretches are more extreme and tend to snap back harder. In this backtest, leveraged and inverse ETFs averaged +1.35% per trade against +0.05% for plain ETFs. Shorting an inverse ETF after a rally is effectively buying the underlying index after a sharp fall.
Is Stretch Fade profitable on its own?
It made 2.12% a year from 2010 to 2026 with a maximum drawdown of -5.14%. That is too small to grow an account on its own. Its value is as a small, low-correlation part of a portfolio. It did best in 2018 and 2022, when the S&P 500 fell.
Is this a trading recommendation?
No. Stretch Fade is an example system for education and discussion. It is in incubation and has not been traded live.